Category: Altitude Real Estate

  • Housing Market: Another Gigantic Difference Between 2008 and 2018

    Housing Market: Another Gigantic Difference Between 2008 and 2018

    Some are attempting to compare the current housing market to the market leading up to the “boom and bust” that we experienced a decade ago. They look at price appreciation and conclude that we are on a similar trajectory, speeding toward another housing crisis.

    However, there is a major difference between the two markets. Last decade, while demand was being artificially created by extremely loose lending standards, a tremendous amount of inventory was coming to the market to satisfy that demand. Below is a graph of the inventory of homes available for sale leading up to the 2008 crash.


    Housing Market: Another Gigantic Difference Between 2008 and 2018 | MyKCM

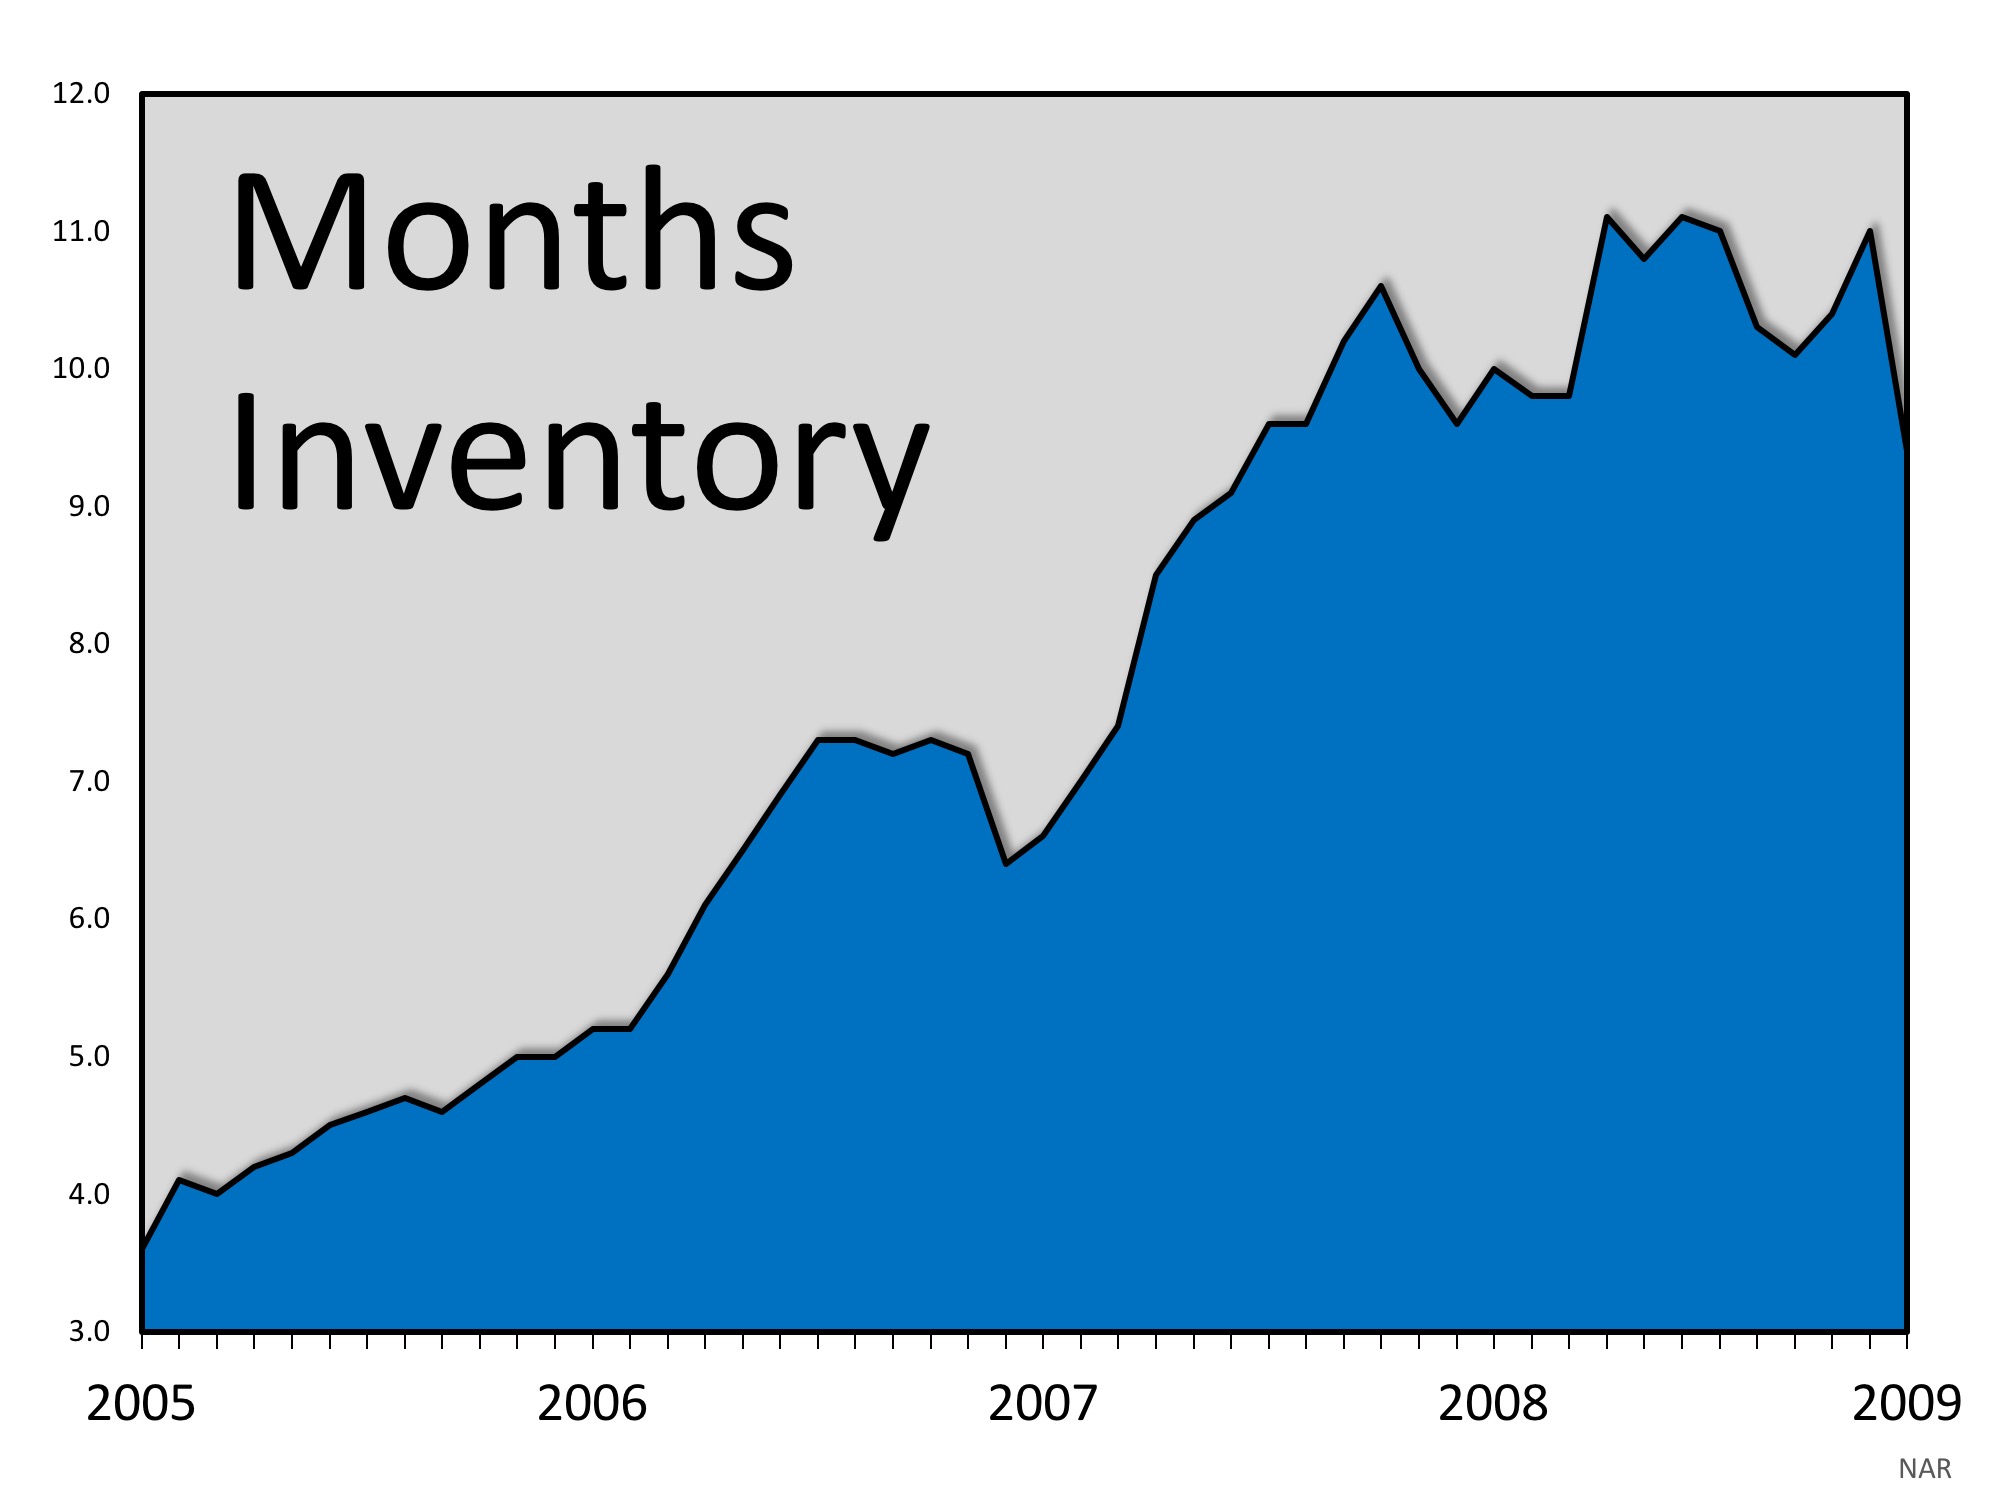
    A normal market should have approximately 6 months supply of housing inventory. As we can see, that number jumped to over 11 months supply leading up to the housing crisis. When questionable mortgage practices ceased, and demand dried up, there was a glut of inventory on the market which caused prices to drop as there was too much supply and not enough demand.

    Today is radically different!

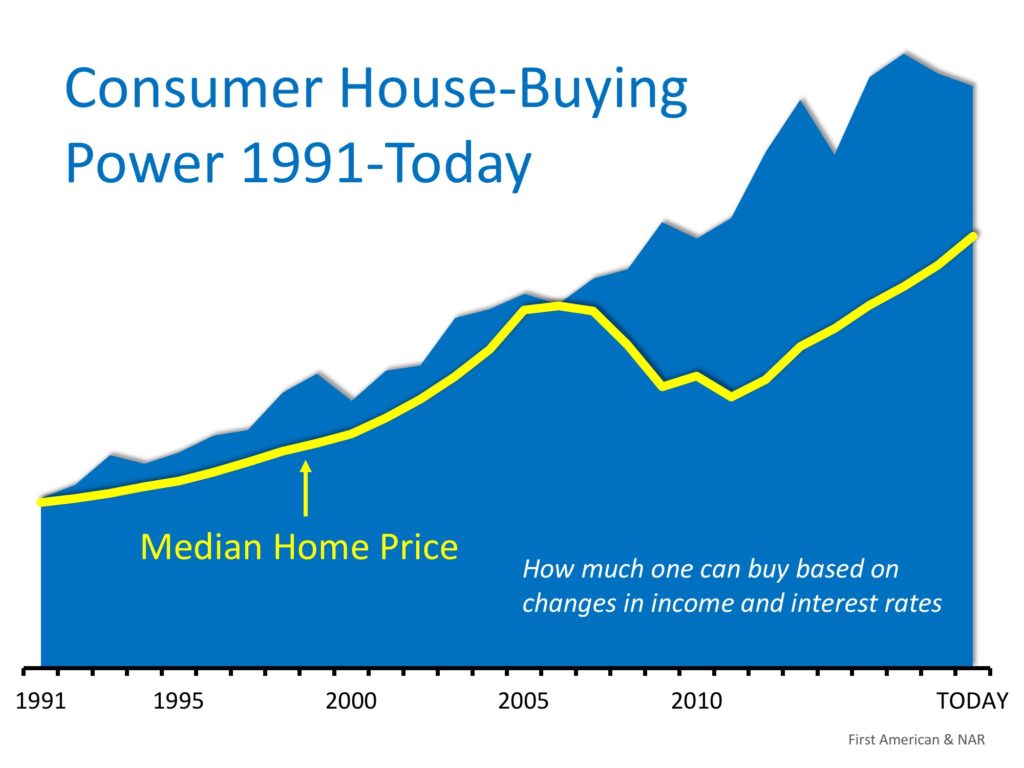
    There are those who believe that low mortgage rates have created an artificial demand in the current market. They fear that if mortgage rates continue to rise, some of the current demand will dry up (which is a possibility).

    However, if we look at supply again, we can see that the current supply of homes is well below the norm of 6 months.
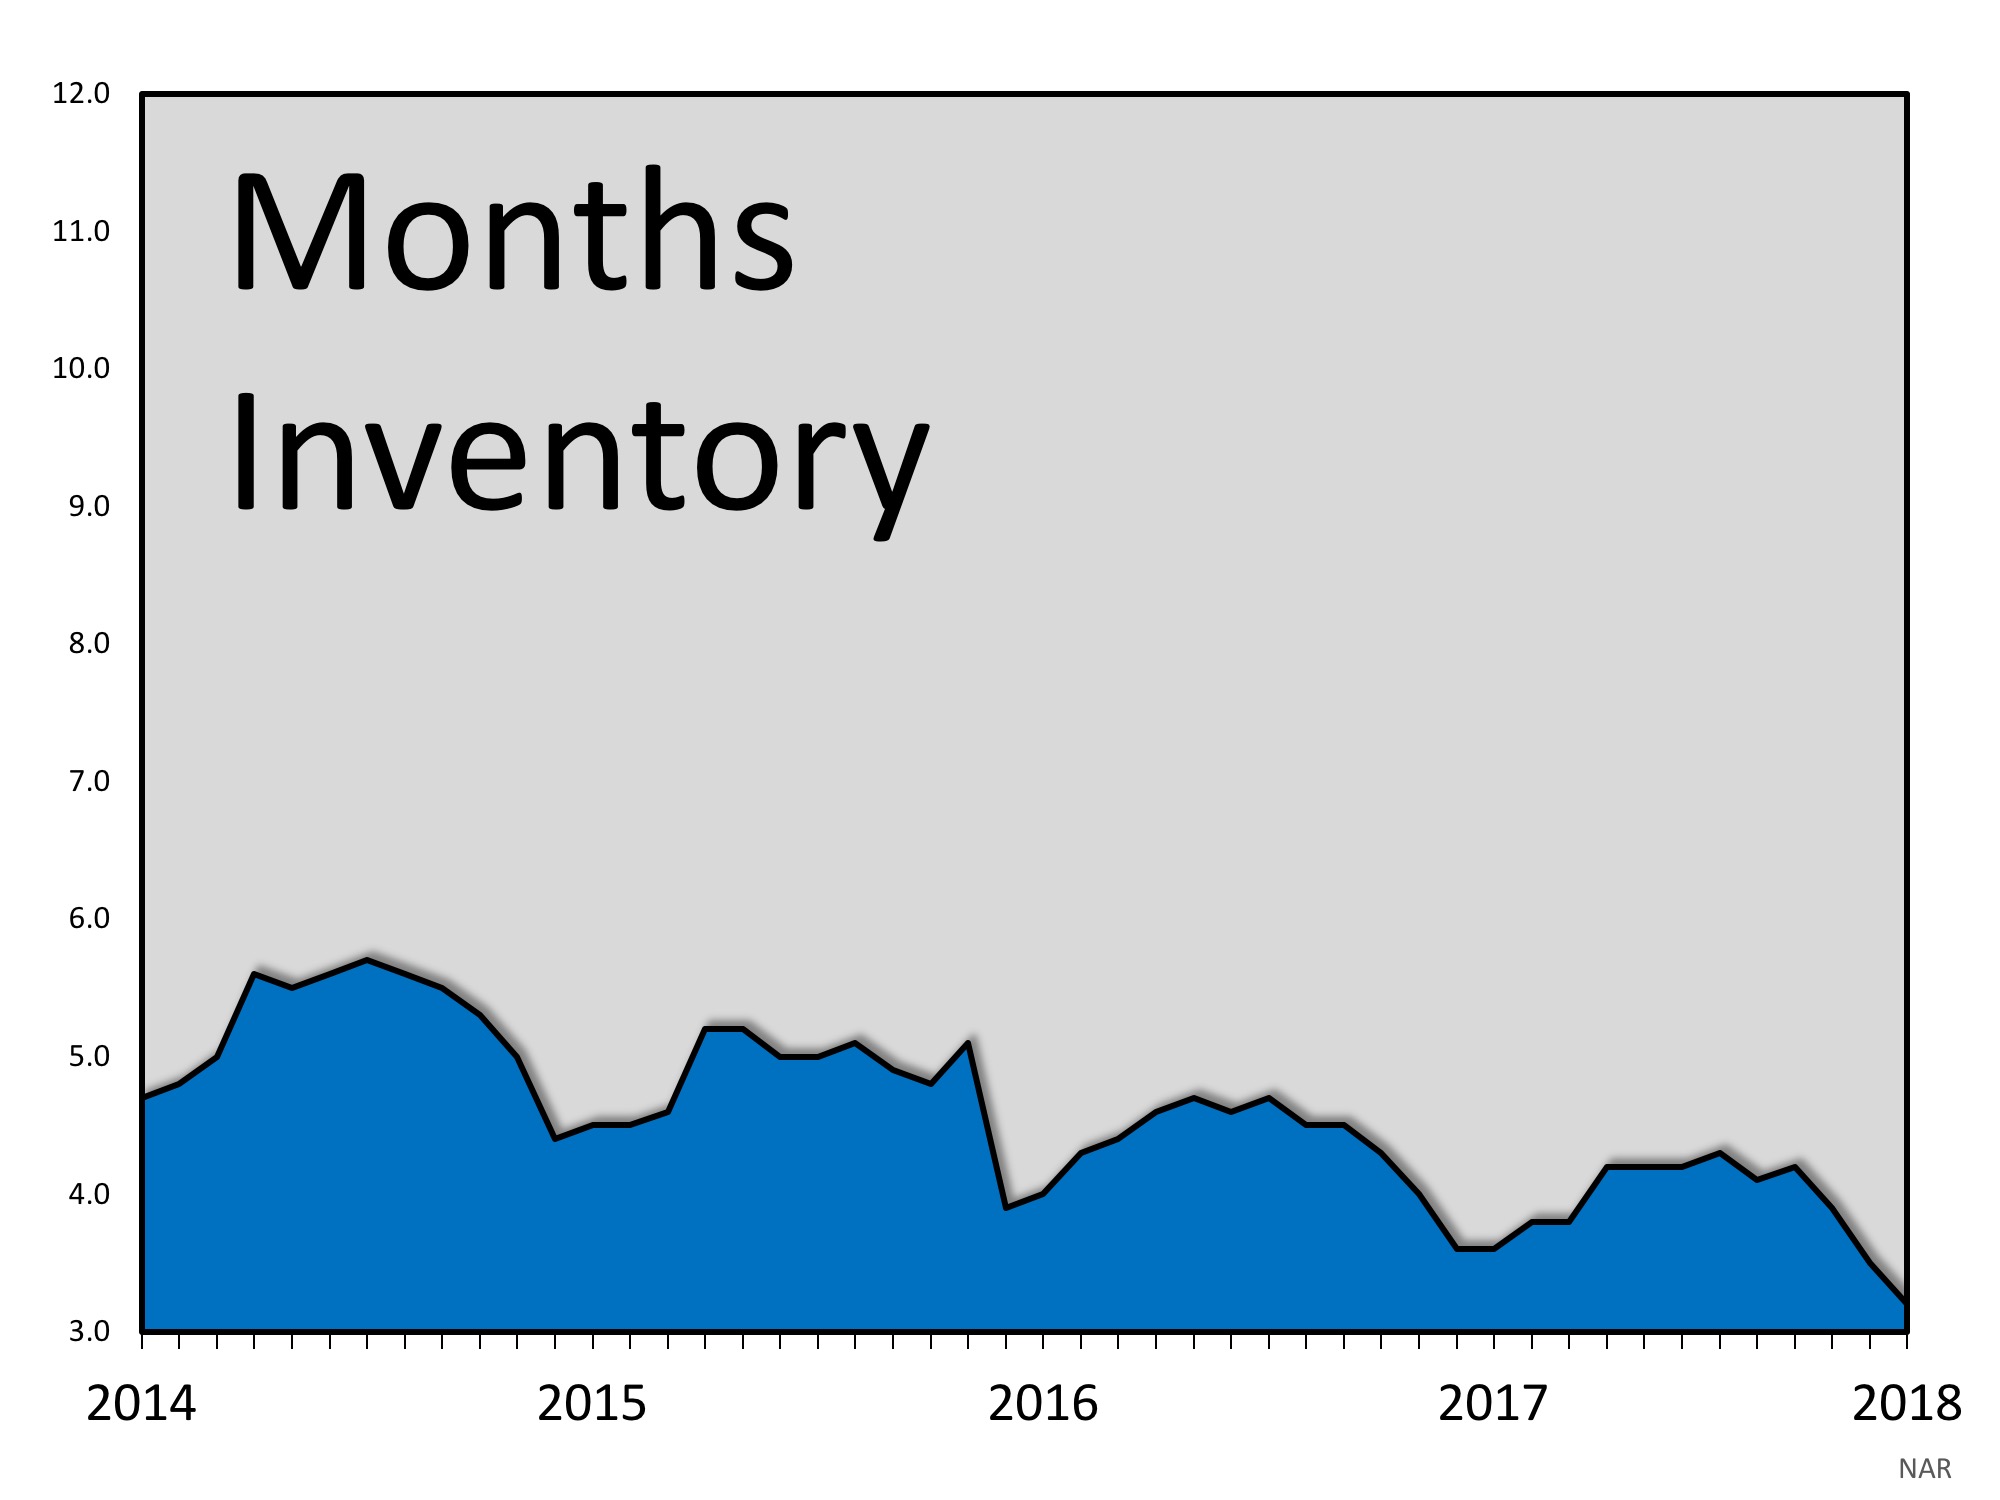
    Housing Market: Another Gigantic Difference Between 2008 and 2018 | MyKCM

    Bottom Line

    We will not have a glut of inventory like we did back in 2008 and home values won’t come tumbling down. Instead, if demand weakens, we will return to a normal market (approximately a 6-month supply) with historic levels of appreciation (3.6% annually).

  • The Wave of Millennial Homebuyers Continues to Swell

    The Wave of Millennial Homebuyers Continues to Swell

    Many have written about the millennial generation and whether or not they, as a whole, believe in homeownership as a part of attaining their American Dream.

    Comparatively speaking, millennials have taken longer to obtain traditional milestones (like getting married, having kids and buying a home) than generations before them, but that does not mean that they do not aspire to still achieve those things.

    For older millennials (aged 25-34) who have established themselves in their career and are starting to build their families, homeownership is the next logical choice.

    According to the Urban Institute’s State of Millennial Housing, the probability of a millennial becoming a homeowner increases by 17.9% if they are married, and by an additional 6.2% if they have children.

    Last year, according to the US Census Bureau, the average age at first marriage was 30 for men and 27 for women, while the National Association of Realtors (NAR) reports that the average first-time homebuyer was 32 years old.

    With most of this generation having yet to age into the ‘Responsibility Zone’(the time in their lives when their responsibilities start to dictate their behaviors), there will be a steady wave of buyers for years to come!

    Those who are currently out in the market searching for a home are being met with a strong, highly competitive seller’s market. NAR’s Chief Economist Lawrence Yun recently commented,

    “Realtors® throughout the country continue to stress that there’s considerable pent-up demand for buying a home among the millennial households in their market.  

    Unfortunately, they’re just not making meaningful ground, and continue to be held back by too few choices in their price range, and thereby missing out on homeownership and wealth gains.”

    Bottom Line

    If you are currently renting and thinking about jumping into the real estate market this year, let’s get together to help you navigate our market.

  • Buying Is Now 26.3% Cheaper Than Renting in the US

    Buying Is Now 26.3% Cheaper Than Renting in the US

    The results of the latest Rent vs. Buy Report from Trulia show that homeownership remains cheaper than renting, with a traditional 30-year fixed rate mortgage, in 98 of the 100 largest metro areas in the United States.

    In the six years that Trulia has conducted this study, this is the first time that it was cheaper to rent than buy in any of the metropolitan areas.

    It’s no surprise, however, that those two metros are San Jose and San Francisco, CA, where median home prices have jumped to over $1 million dollars this year. Home values in San Jose have risen 29% in the last year, while rents have remained relatively unchanged.

    For the 98 metros where homeownership wins out, 97 of them show a double-digit advantage when buying. The range is an average of 2.0% less expensive in Honolulu (HI), all the way up to 48.9% in Detroit (MI), and 26.3% nationwide!

    Below is a map of the 100 metros that were studied. The darker the blue dot on the metro, the cheaper it is to buy there.

    Buying Is Now 26.3% Cheaper Than Renting in the US | MyKCM

    In order to calculate the true cost of renting vs. buying, Trulia includes all assumed renting costs, including one-time costs (like security deposits), and compares them to the monthly costs of owning a home (insurance, mortgage payments, taxes, and maintenance) including one-time costs (down payments, closing costs, sale proceeds). They also assume that households stay in their home for seven years, put down a 20% down payment, and take out a 30-year fixed rate mortgage. The full methodology is included with the study results here.

    Below is a chart created with the data from the last six years of the study, showing the impact of the median home price, rental price, and 30-year fixed rate interest rate used to calculate the ‘cheaper to buy’ metric.

    Buying Is Now 26.3% Cheaper Than Renting in the US | MyKCM

    In 2016, when buying was 41.3% less expensive than renting, the average mortgage rate was the driving force behind the difference. Rates this year are the highest they have been in six years which has narrowed the gap, all while home price appreciation has also been driven up by a lack of homes for sale.

    Cheryl Young, Trulia’s Chief Economist, had this to say,

    “One point deserves emphasizing: The ultra-costly San Francisco Bay Area is not a harbinger for the nation as a whole. While renting may outweigh buying in San Jose and San Francisco, it is unlikely that renting will tip the scales nationally anytime soon.”

    Bottom Line

    Homeownership provides many benefits beyond the financial ones. If you are one of the many renters out there who would like to evaluate your ability to buy this year, let’s get together to find your dream home.

  • Rethinking Your “Wants” and “Needs” Lists

    Rethinking Your “Wants” and “Needs” Lists

    Most buyers make a list of all the things they need in their next home which are usually intermingled with the things they want in their next home. Sometimes it is very easy to delineate which is which, but sometimes there are things on the want list that so affect the quality of life that they really skirt the line between the two.

    Here are some ways buyers have worked around a problem to get more things checked off their wants and needs lists:

    • Not enough bedrooms – although this may seem like a deal-breaker, before you discount a home entirely due to its lacking bedroom count, see if there is a flex space somewhere that can be converted to a bedroom. There may be a room that is being used as an office, a flex space that makes sense to wall off, or even extra space in an attic or basement that is ready to be finished off. Remember, bedrooms must have a point of entry and an egress (window) and at least 70 square feet of space. You can even consider built-in cabinets if there is no closet.
    • Not enough kitchen cabinets or pantry – There may be a laundry room or mud room nearby or even a spare closet with space for shelving or cabinets. Sometimes small appliances that are not used often, paper towels that are purchased in bulk, etc, can be stored on shelving or in cabinets in the garage.
    • No rec room for the kids – Depending on the age of the kids, perhaps a play shed or exterior structure could be a good solution. Kids love having their own special spaces, so consider a treehouse, playhouse or even something that is weather-tight. Remember to check with your HOA or zoning to make sure something like this would be allowed and of course, safety first.
    • No storage for kayak or bikes in garage – If the garage has some height, there are two possible solutions. By building an accessible loft space, you could gain a few feet of extra storage above a portion of the garage, freeing up the room on the ground for your recreation equipment. Alternatively, there are now rec equipment pulleys available to hoist those bikes and kayaks vertically to utilize open space above the vehicles.
    • No fireplace – Fireplaces have come a long way with a number of different fuel options. Although an authentic wood-burning unit would require serious retrofitting, there are some gas, electric, or even LED models that are much easier to install – some simply by plugging in.
    • No air-conditioning – One popular trend is having single-room installed units that can be controlled independently. This is a great solution for heating or cooling one or several rooms without an extensive renovation.

    Don’t be afraid to think outside the box if you come across a home that is otherwise the best fit. Remember, you can’t change the location or usually the lot size, but there are some ways you can increase the functionality of a space to work for you without a lot of time or money. Just browse Pinterest or DIY and you can easily find innovative solutions for the problems that you may encounter. I can’t wait to hear about your next wants and needs lists!

  • You Need an Agent Who Will Always Put You First

    You Need an Agent Who Will Always Put You First

    Whether you are a rookie homebuyer or have gone through the process many times, having a local real estate expert who is well versed in the neighborhood you are looking to move to, as well as the trends of that area, should be your goal while home shopping.

    One great example of an agent who is in your corner and is always looking out for your best interests is one of the main characters on ABC’s Modern Family, Phil Dunphy.

    For those who aren’t familiar with the character, Phil is a REALTOR® with a huge heart who always strives to do his best for his family and his clients.

    In one episode, he even shared an oath that he created and holds himself accountable to:

    “On my honor, I promise to aid in man’s quest for shelter, to recognize I’m not just in the business of houses — I’m in the business of dreams in the shape of houses. To disclose all illegal additions, shoddy construction, murders, and ghosts. And to put my clients’ needs before my own.” 

    While this might seem silly, as it was definitely written with humor in mind, the themes of helping someone achieve the American Dream and putting a client’s needs above his own are not to be taken lightly.

    Bottom Line

    When you make the decision to enter the housing market, as either a buyer or a seller, make sure you look for an agent who exemplifies these values and will help you through every step of the process.

  • 4 Reasons Why We Are Not Heading Toward Another Housing Bubble

    4 Reasons Why We Are Not Heading Toward Another Housing Bubble

    With home prices continuing to appreciate above historic levels, some are concerned that we may be heading for another housing ‘boom & bust.’ It is important to remember, however, that today’s market is quite different than the bubble market of twelve years ago.

    Here are four key metrics that will explain why:

    1. Home Prices
    2. Mortgage Standards
    3. Foreclosure Rates
    4. Housing Affordability

    1. HOME PRICES

    There is no doubt that home prices have reached 2006 levels in many markets across the country. However, after more than a decade, home prices should be much higher based on inflation alone.

    Last week, CoreLogic reported that,

    “The inflation-adjusted U.S. median sale price in June 2006 was $247,110 (or $199,899 in 2006 dollars), compared with $213,400 in March 2018.” (This is the latest data available.)

    2. MORTGAGE STANDARDS

    Many are concerned that lending institutions are again easing standards to a level that helped create the last housing bubble. However, there is proof that today’s standards are nowhere near as lenient as they were leading up to the crash.

    The Urban Institute’s Housing Finance Policy Center issues a monthly index which,

    “…measures the percentage of home purchase loans that are likely to default—that is, go unpaid for more than 90 days past their due date. A lower HCAI indicates that lenders are unwilling to tolerate defaults and are imposing tighter lending standards, making it harder to get a loan. A higher HCAI indicates that lenders are willing to tolerate defaults and are taking more risks, making it easier to get a loan.”

    Their July Housing Credit Availability Index revealed:

    “Significant space remains to safely expand the credit box. If the current default risk was doubled across all channels, risk would still be well within the pre-crisis standard of 12.5 percent from 2001 to 2003 for the whole mortgage market.”

    3. FORECLOSURE RATES

    A major cause of the housing crash last decade was the number of foreclosures that hit the market. They not only increased the supply of homes for sale but were also being sold at 20-50% discounts. Foreclosures helped drive down all home values.

    Today, foreclosure numbers are lower than they were before the housing boom. Here are the number of consumers with new foreclosures according to the Federal Reserve’s most recent Household Debt and Credit Report:

    • 2003: 203,320 (earliest reported numbers)
    • 2009: 566,180 (at the valley of the crash)
    • Today: 76,480

    Foreclosures today are less than 40% of what they were in 2003.

    4. HOUSING AFFORDABILITY

    Contrary to many headlines, home affordability is better now than it was prior to the last housing boom. In the same article referenced in #1, CoreLogic revealed that in the vast majority of markets, “the inflation-adjusted, principal-and-interest mortgage payments that homebuyers have committed to this year remain much lower than their pre-crisis peaks.”

    They went on to explain:

    “The main reason the typical mortgage payment remains well below record levels in most of the country is that the average mortgage rate back in June 2006, when the U.S. typical mortgage payment peaked, was about 6.7 percent, compared with an average mortgage rate of about 4.4 percent in March 2018.”

    The “price” of a home may be higher, but the “cost” is still below historic norms.

    Bottom Line

    After using these four key housing metrics to compare today to last decade, we can see that the current market is not anything like that bubble market.

  • Lack of Listings Slowing Down the Market

    Lack of Listings Slowing Down the Market

    As the real estate market continues to move down the road to a complete recovery, we see home values and home sales increasing while distressed sales (foreclosures and short sales) continue to fall to their lowest points in years. There is no doubt that the housing market will continue to strengthen throughout 2018.

    However, there is one thing that may cause the industry to tap the brakes: a lack of housing inventory!

    Here’s what a few industry experts have to say about the current inventory crisis:

    Lawrence Yun, Chief Economist for the National Association of Realtors

    “Inventory coming onto the market during this year’s spring buying season…was not even close to being enough to satisfy demand, that is why home prices keep outpacing incomes and listings are going under contract in less than a month – and much faster – in many parts of the country.”

    Sam Khater, Chief Economist for Freddie Mac

    “While this spring’s sudden rise in mortgage rates [took] up a good chunk of the conversation, it’s the stubbornly low inventory levels in much of the country that are preventing sales from really taking off like they should… Most markets simply need a lot more new and existing supply to cool price growth and give buyers enough choices.”

    Alexandra Lee, Housing Data Analyst for Trulia

    This seasonal inventory jump wasn’t enough to offset the historical year-over-year downward trend that has continued over 14 consecutive quarters…Despite the second-quarter gain, inventory was down 5.3% from a year ago. Still, this represents an easing of the double-digit drops we’ve been seeing since the second quarter of 2017.”

    Bottom Line

    If you are thinking about selling, now may be the time. Demand for your house will be strongest while there is still very little competition which could lead to a quick sale for a great price.

  • Want to Sell Your House Faster? Don’t Forget to Stage! [INFOGRAPHIC]

    Want to Sell Your House Faster? Don’t Forget to Stage! [INFOGRAPHIC]

    Some Highlights:

    • The National Association of Realtors surveyed their members & released the findings of their Profile of Home Staging.
    • 62% of seller’s agents say that staging a home decreases the amount of time a home spends on the market.
    • 50% of staged homes saw a 1-10% increase in dollar-value offers from buyers.
    • 77% of buyer’s agents said staging made it easier for buyers to visualize the home as their own.
    • The top rooms to stage in order to attract more buyers are the living room, master bedroom, kitchen, and dining room.

  • House-Buying Power at Near-Historic Levels

    House-Buying Power at Near-Historic Levels

    We keep hearing that home affordability is approaching crisis levels. While this may be true in a few metros across the country, housing affordability is not a challenge in the clear majority of the country. In their most recent Real House Price Index, First American reported that consumer “house-buying power” is at “near-historic levels.”

    Their index is based on three components:

    1. Median Household Income
    2. Mortgage Interest Rates
    3. Home Prices

    The report explains:

    “Changing incomes and interest rates either increase or decrease consumer house-buying power or affordability. When incomes rise and/or mortgage rates fall, consumer house-buying power increases.”

    Combining these three crucial pieces of the home purchasing process, First American created an index delineating the actual home-buying power that consumers have had dating back to 1991.

    Here is a graph comparing First American’s consumer house-buying power (blue area) to the actual median home price that year from the National Association of Realtors (yellow line).


    Consumer house-buyer power has been greater than the actual price of a home since 1991. And, the spread is larger over the last decade.


    Bottom Line

    Even though home prices are increasing rapidly and are now close to the values last seen a decade ago, the actual affordability of a home is much better now. As Chief Economist Mark Fleming explains in the report:

    “Though unadjusted house prices have risen to record highs, consumer house-buying power stands at near-historic levels, as well, signaling that real house prices are not even close to their historical peak.”

  • How Long Do Most Families Live in a House?

    How Long Do Most Families Live in a House?

    The National Association of Realtors (NAR) keeps historical data on many aspects of homeownership. One of their data points, which has changed dramatically, is the median tenure of a family in a home, meaning how long a family stays in a home prior to moving.

    As the graph below shows, over the last twenty years (1985-2008), the median tenure averaged exactly six years. However, since 2014, that average is almost ten years – an increase of almost 50%.

    How Long Do Most Families Live in a House? | MyKCM

    Why the dramatic increase?

    The reasons for this change are plentiful!

    The fall in home prices during the housing crisis left many homeowners in a negative equity situation (where their home was worth less than the mortgage on the property). Also, the uncertainty of the economy made some homeowners much more fiscally conservative about making a move.

    With home prices rising dramatically over the last several years, 95.3% of homes with a mortgage are now in a positive equity situationaccording to CoreLogic.

    With the economy coming back and wages starting to increase, many homeowners are in a much better financial situation than they were just a few short years ago.

    One other reason for the increase was brought to light by NAR in their 2018 Home Buyer and Seller Generational Trends ReportAccording to the report,

    “Sellers 37 years and younger stayed in their home for six years…”

    These homeowners, who are either looking for more space to accommodate their growing families or for better school districts to do the same, are likely to move more often (compared to typical sellers who stayed in their homes for 10 years). The homeownership rate among young families, however, has still not caught up to previous generations, resulting in the jump we have seen in median tenure!

    What does this mean for housing?

    Many believe that a large portion of homeowners are not in a house that is best for their current family circumstance; they could be baby boomers living in an empty, four-bedroom colonial, or a millennial couple living in a one-bedroom condo planning to start a family.

    These homeowners are ready to make a move, and since a lack of housing inventory is still a major challenge in the current housing market, this could be great news.