Category: Altitude Real Estate

  • You Need an Agent Who Will Put You First

    You Need an Agent Who Will Put You First

    When it comes to buying a home, whether you are a rookie homebuyer or have gone through the process many times, having a local real estate expert who is well versed in the neighborhood you are looking to move into, as well as the trends of that area, should be your goal.

    One great example of an agent who is in your corner and is always looking out for your best interests is one of the main characters on ABC’s Modern Family, Phil Dunphy.

    For those who aren’t familiar, the character Phil is a Realtor with a huge heart who always strives to do his best for his family and his clients.

    In one recent episode, Phil even shared the oath that he created and holds himself accountable to:

    “On my honor, I promise to aid in man’s quest for shelter, to recognize I’m not just in the business of houses — I’m in the business of dreams in the shape of houses. To disclose all illegal additions, shoddy construction, murders, and ghosts. And to put my clients’ needs before my own.” 

    While this might seem silly, and it was definitely written with humor in mind, the themes of helping someone achieve the American Dream and putting a client’s needs above your own are not to be taken lightly. 

    Bottom Line

    When you make the decision to enter the housing market, as either a buyer or a seller, make sure you look for an agent who exemplifies these values and will help you through every step of the process.

  • Start 2017 Off Right… List Your House for Sale

    Start 2017 Off Right… List Your House for Sale

    As we are about to bring in the New Year, families across the country will be deciding if this is the year that they will sell their current house and move into their dream home. Many will decide that it is smarter to wait until the spring “buyer’s market” to list their house. In the past, that might have made sense. However, this winter is not like recent years.

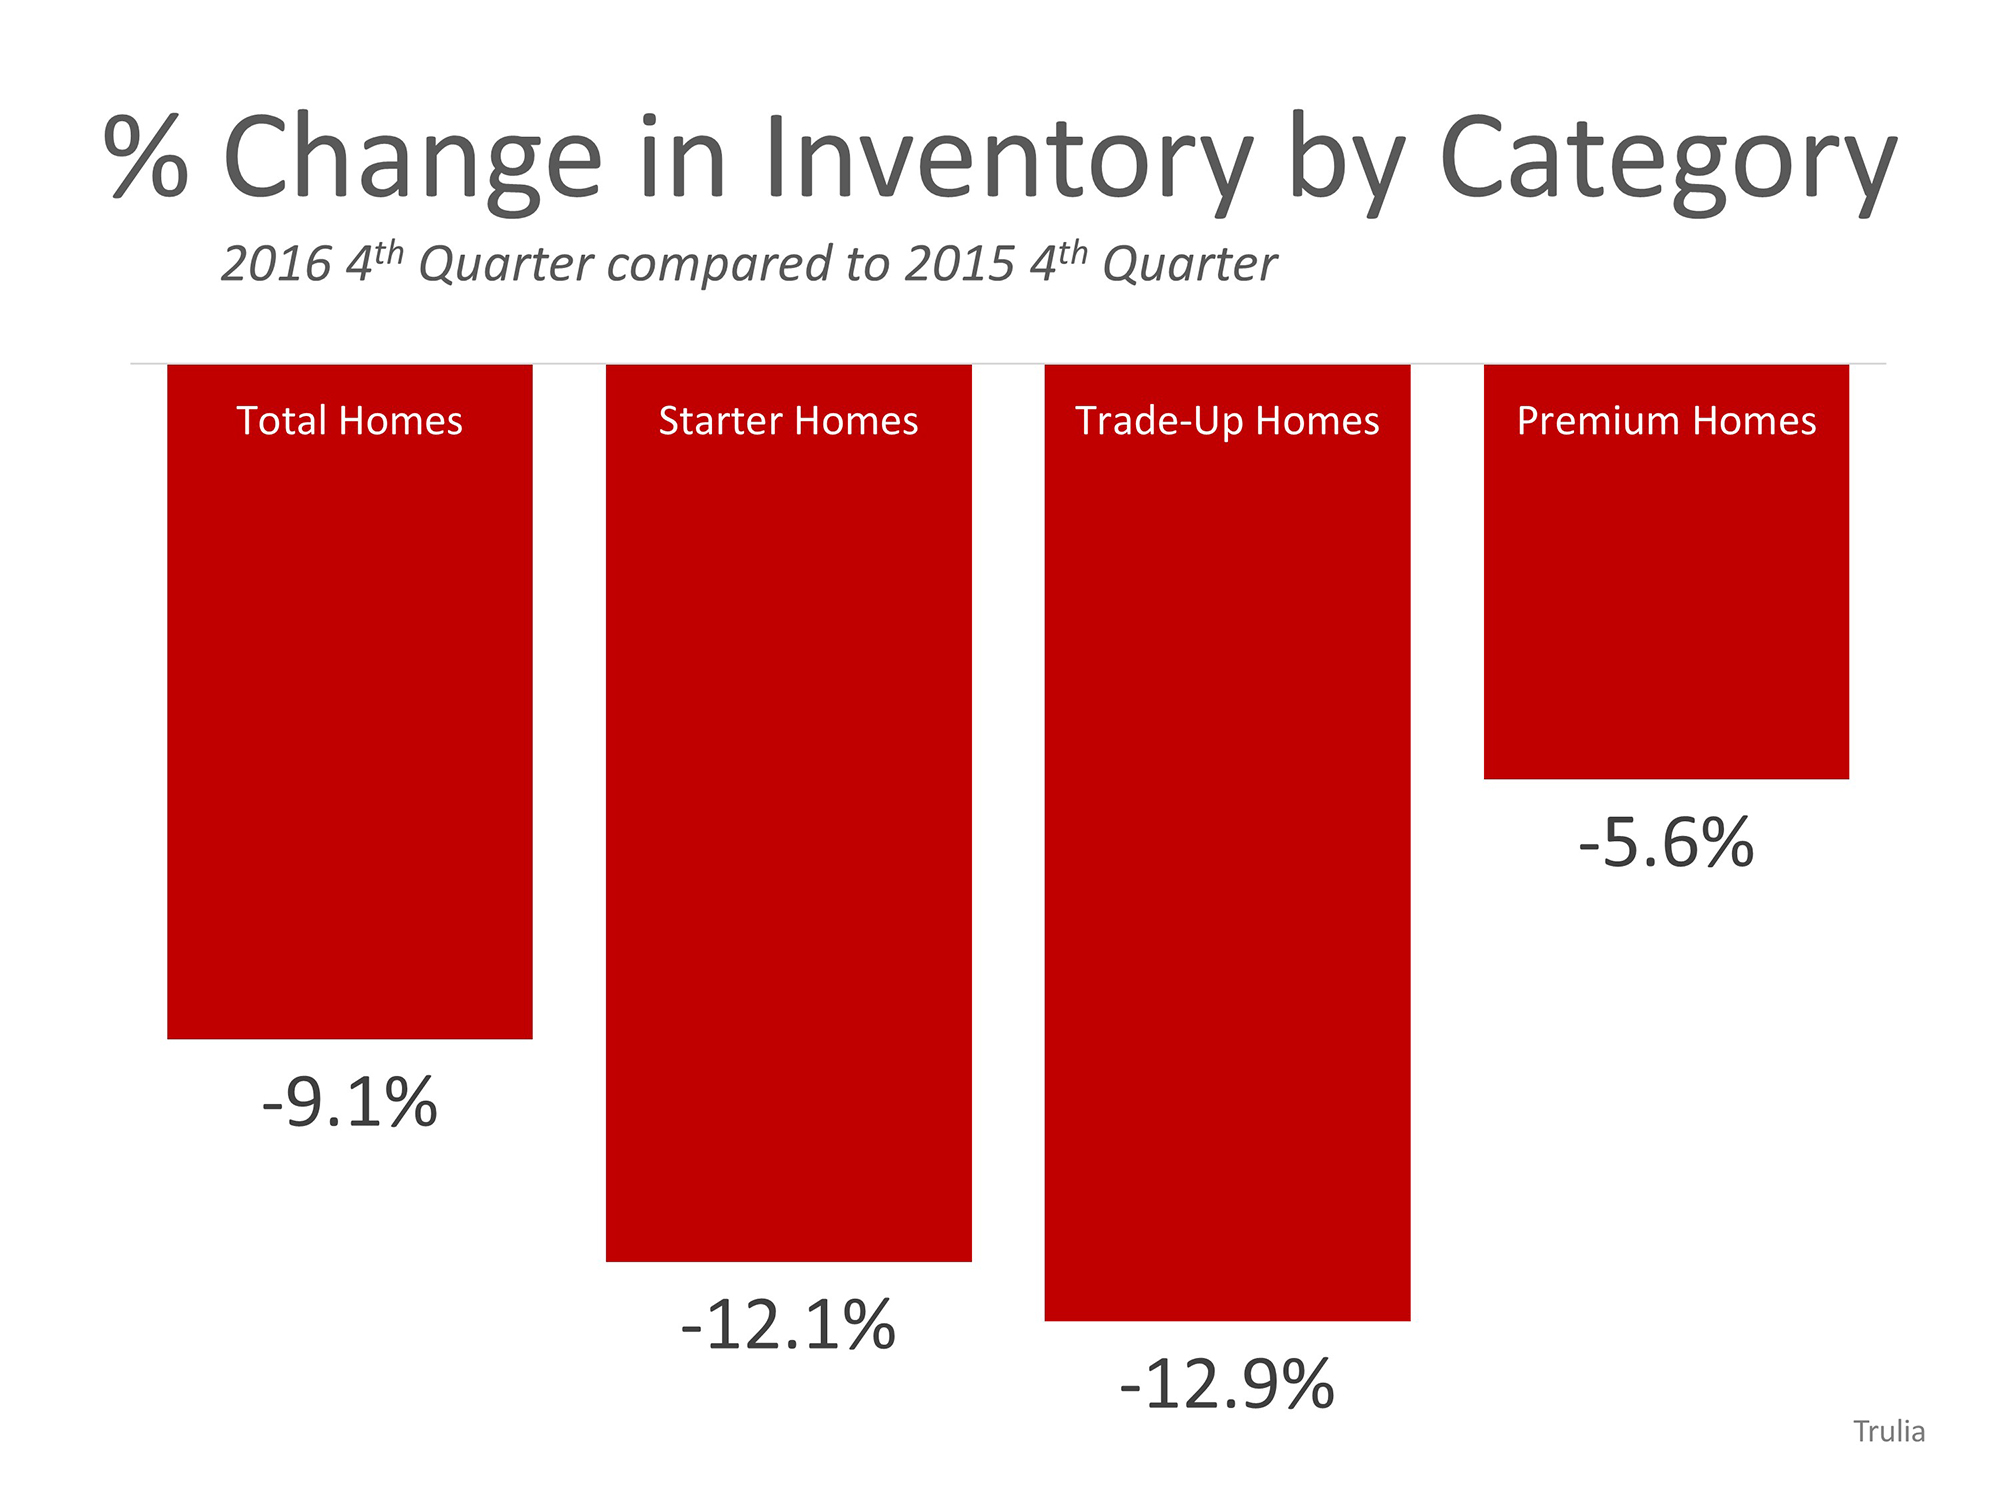
    The recent jump in mortgage rates has forced buyers off the fence and into the market, resulting in incredibly strong demand RIGHT NOW!! At the same time, inventory levels of homes for sale have dropped dramatically as compared to this time last year.

    Here is a chart showing the decrease in inventory levels by category:

    Start 2017 Off Right… List Your House for Sale | MyKCM

    Bottom Line

    Demand for your home is very strong right now while your competition (other homes for sale) is at a historically low level. If you are thinking of selling in 2017, now may be the time.

  • Homeowner’s Net Worth Is 45x Greater Than A Renter’s

    Homeowner’s Net Worth Is 45x Greater Than A Renter’s

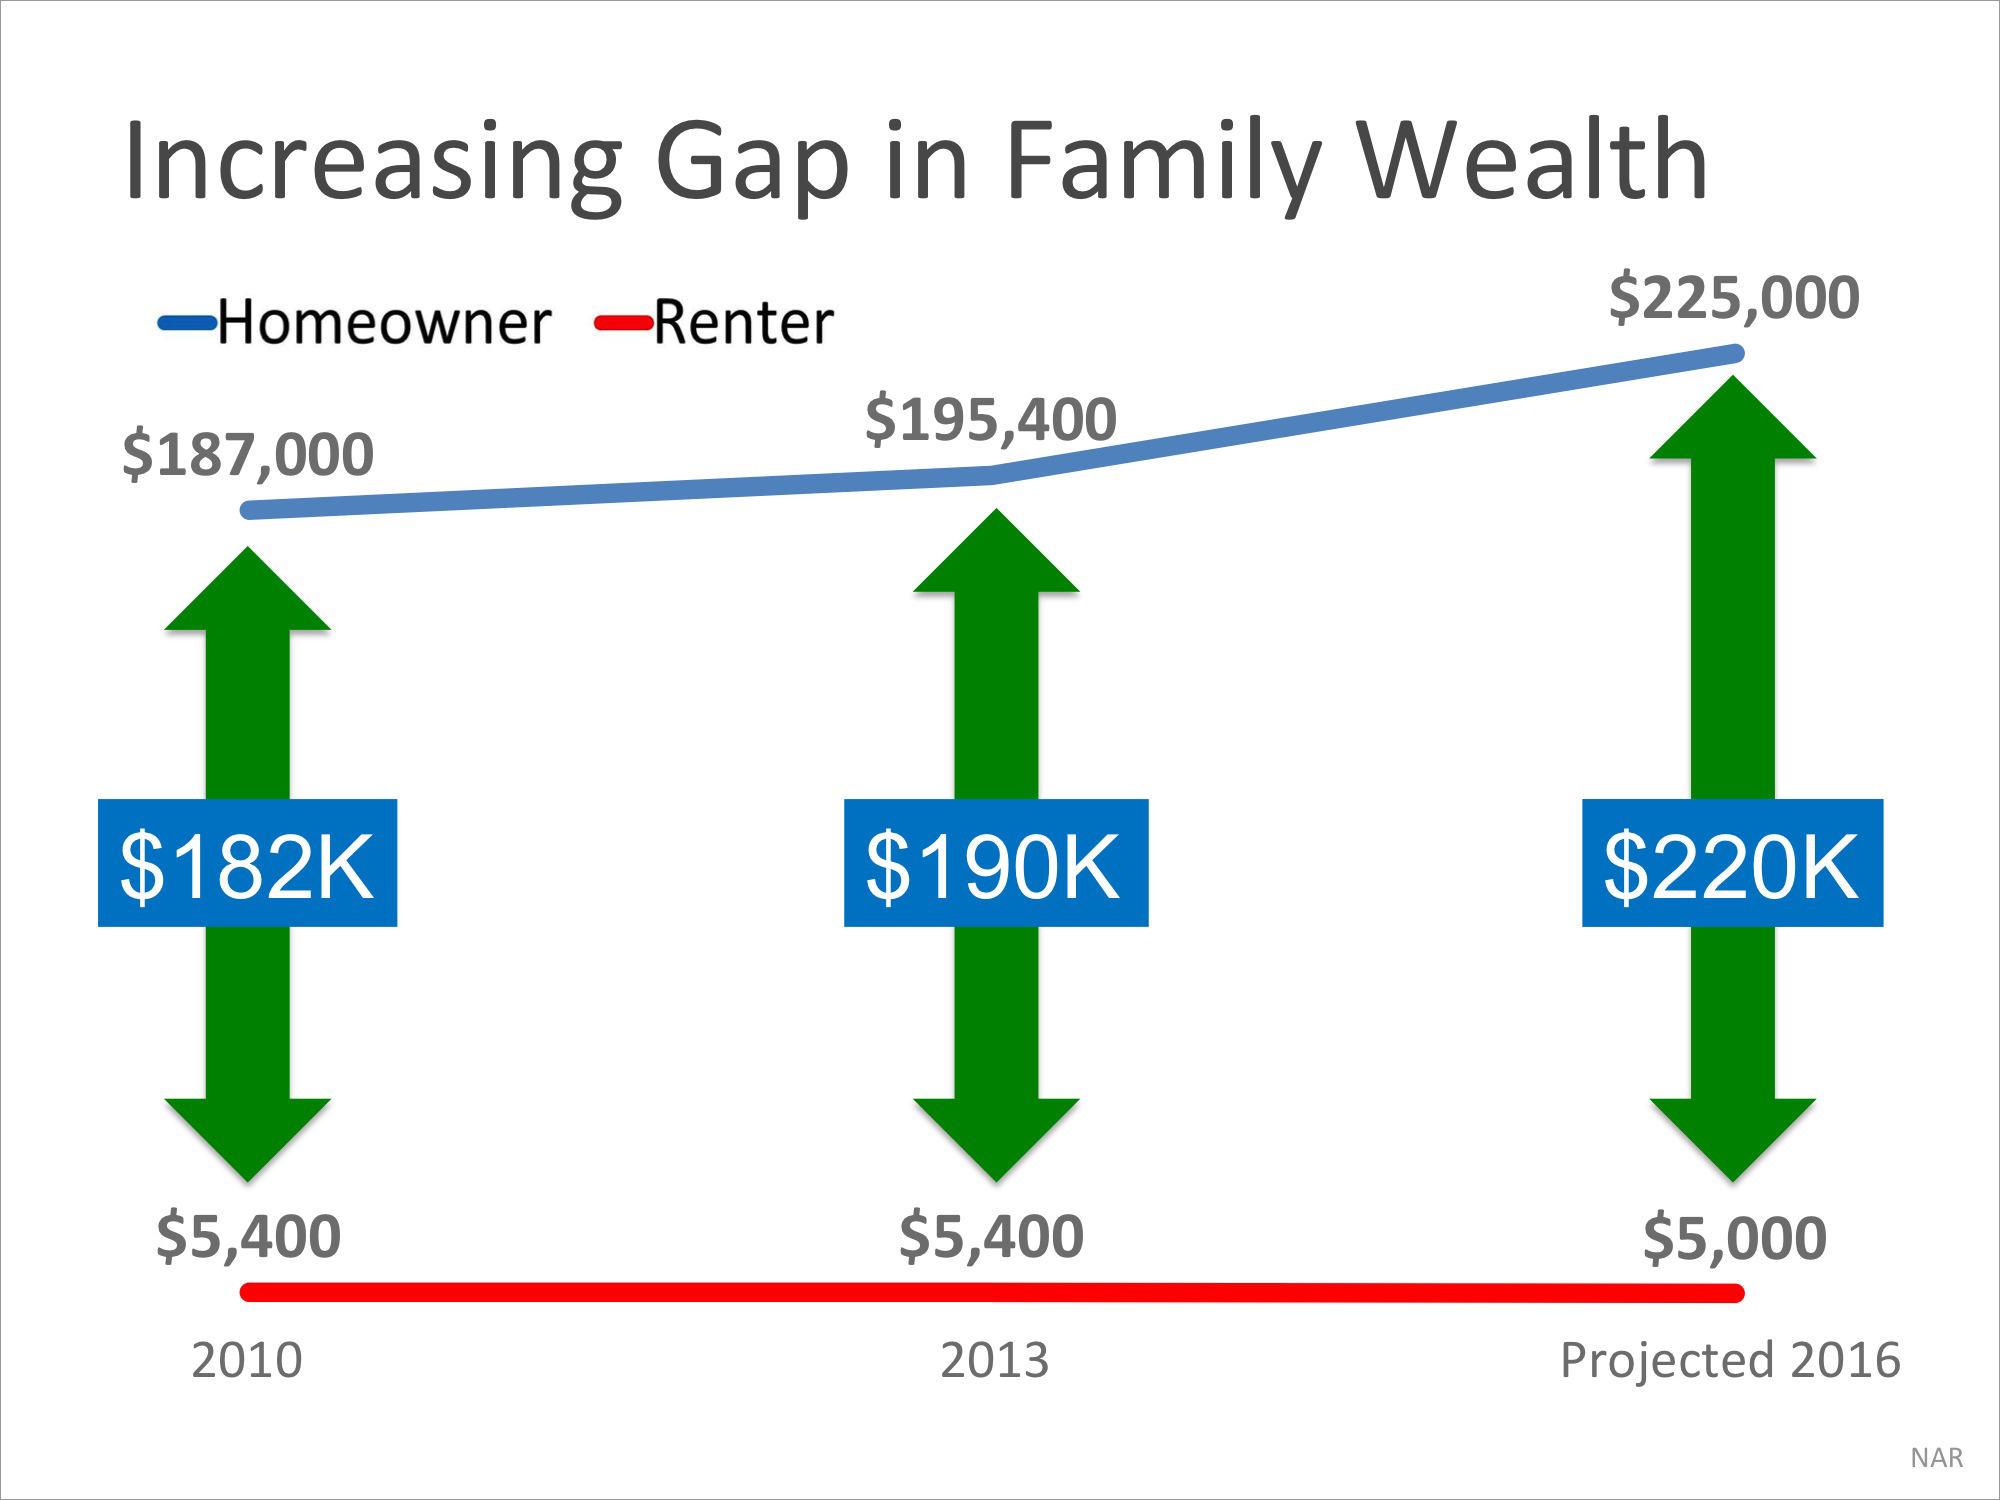
    Every three years, the Federal Reserve conducts a Survey of Consumer Finances in which they collect data across all economic and social groups. The latest survey, which includes data from 2010-2013, reports that a homeowner’s net worth is 36 times greater than that of a renter ($194,500 vs. $5,400).

    In a Forbes article, the National Association of Realtors’ (NAR) Chief Economist Lawrence Yun predicts that by the end of 2016, the net worth gap will widen even further to 45 times greater.

    The graph below demonstrates the results of the last two Federal Reserve studies and Yun’s prediction:

    Homeowner’s Net Worth Is 45x Greater Than a Renter’s | MyKCM

    Put Your Housing Cost to Work for You

    As we’ve said before, simply put, homeownership is a form of ‘forced savings.’ Every time you pay your mortgage, you are contributing to your net worth. Every time you pay your rent, you are contributing to your landlord’s net worth.

    The latest National Housing Pulse Survey from NAR reveals that 85% of consumers believe that purchasing a home is a good financial decision. Yun comments:

    “Though there will always be discussion about whether to buy or rent, or whether the stock market offers a bigger return than real estate, the reality is that homeowners steadily build wealth. The simplest math shouldn’t be overlooked.”

    Bottom Line

    If you are interested in finding out if you could put your housing cost to work for you by purchasing a home, let’s get together and evaluate your ability to buy today!

  • Top 5 Reasons You Should Not For Sale By Owner

    Top 5 Reasons You Should Not For Sale By Owner

    In today’s market, with home prices rising and a lack of inventory, some homeowners may consider trying to sell their home on their own, known in the industry as a For Sale by Owner (FSBO). There are several reasons why this might not be a good idea for the vast majority of sellers.

    Here are the top five reasons:

    1. Exposure to Prospective Buyers

    Recent studies have shown that 94% of buyers search online for a home. That is in comparison to only 17% looking at print newspaper ads. Most real estate agents have an internet strategy to promote the sale of your home. Do you?

    2. Results Come from the Internet

    Where did buyers find the home they actually purchased?

    • 51% on the internet
    • 34% from a Real Estate Agent
    • 9% from a yard sign
    • 1% from newspapers

    The days of selling your house by just putting up a sign and putting it in the paper are long gone. Having a strong internet strategy is crucial.

    3. There Are Too Many People to Negotiate With

    Here is a list of some of the people with whom you must be prepared to negotiate if you decide to For Sale By Owner:

    • The buyer who wants the best deal possible
    • The buyer’s agent who solely represents the best interest of the buyer
    • The buyer’s attorney (in some parts of the country)
    • The home inspection companies, which work for the buyer and will almost always find some problems with the house
    • The appraiser if there is a question of value

    4. FSBOing Has Become More And More Difficult

    The paperwork involved in selling and buying a home has increased dramatically as industry disclosures and regulations have become mandatory. This is one of the reasons that the percentage of people FSBOing has dropped from 19% to 8% over the last 20+ years.

    The 8% share represents the lowest recorded figure since NAR began collecting data in 1981.

    5. You Net More Money When Using an Agent

    Many homeowners believe that they will save the real estate commission by selling on their own. Realize that the main reason buyers look at FSBOs is because they also believe they can save the real estate agent’s commission. The seller and buyer can’t both save the commission.

    Studies have shown that the typical house sold by the homeowner sells for $185,000, while the typical house sold by an agent sells for $245,000. This doesn’t mean that an agent can get $60,000 more for your home, as studies have shown that people are more likely to FSBO in markets with lower price points. However, it does show that selling on your own might not make sense.

    Bottom Line

    Before you decide to take on the challenges of selling your house on your own, let’s get together and discuss the options available in your market today.

  • Existing Home Sales Surge Through The Holidays

    Existing Home Sales Surge Through The Holidays

    Some Highlights:

    • November’s Existing Home Sales report revealed that sales are now at an annual pace of 5.61 million which is “now the highest since February 2007 (5.79 million) and is 15.4% higher than a year ago (4.86 million).”
    • Total housing inventory (or the inventory of homes for sale) fell 8.0% from last month and is now 9.3% lower than November 2015.
    • Inventory has dropped year-over-year for the last 18 months.
    • The median price for all home sales in November was $234,900, up 6.8% from last year and marks the 57th consecutive month of year-over-year gains.
  • The Fed Raised Rates: What Does that Mean for Housing?

    The Fed Raised Rates: What Does that Mean for Housing?

    You may have heard that the Federal Reserve raised rates last week… But what does that mean if you are looking to buy a home in the near future?

    Many in the housing industry have predicted that the Federal Open Market Committee (FOMC), the policy-making arm of the Federal Reserve, would vote to raise the federal fund’s target rate at their December meeting. For only the second time in a decade, this is exactly what happened.

    There were many factors that contributed to the 0.25 point increase (from 0.50 to 0.75), but many are pointing to the latest jobs report and low unemployment rate (4.6%) as the main reason.

    Tim Manni, Mortgage Expert at Nerd Wallet, had this to say,

    “Homebuyers shouldn’t be particularly concerned with [last week’s] Fed move. Even with rates hovering over 4 percent, they’re still historically low. Most market observers are expecting a gradual rise in home loan rates in the near term, anticipating mortgage rates to stay under 5 percent through 2017.”

    Bottom Line

    Only time will tell what the long-term impact of the rate hike will be, but in the short term, there should be no reason for alarm.

  • Student Loans = Higher Credit Scores

    Student Loans = Higher Credit Scores

    According to a recent analysis by CoreLogic, Millennial renters (aged 20-34) who have student loan debt also have higher credit scores than those who do not have student loans.

    This may come as a surprise, as there is so much talk about student loans burdening Millennials and holding them back from many milestones that previous generations have been able to achieve (i.e. homeownership, investing for retirement).

    CoreLogic used the information provided on rental applications and the applicants’ credit history from credit bureaus to determine if there was a correlation between student loan debt and credit scores.

    The analysis concluded that:

    “Student loan debt did not prevent millennials from access to credit even though it may delay their homebuying decisions.”

    In fact, those with a higher amount of debt actually had higher credit scores.

    “Renters with student loan debt have higher average credit scores than those without; and those with higher debt amounts have higher average credit scores than those with lower student loan debt amounts.”

    Bottom Line

    Millennials are on pace to become the most educated generation in our nation’s history, with that comes a pretty big bill for education. But there is a light at the end of the tunnel:

    “Despite the fact that student loan debt has grown into the nation’s second largest consumer debt, following mortgage, and has created a significant financial burden for millennials, it does not appear to prevent millennials from accessing credit.”

  • Whether You Rent or Buy: Either Way You’re Paying a Mortgage

    Whether You Rent or Buy: Either Way You’re Paying a Mortgage

    There are some renters who have not yet purchased a home because they are uncomfortable taking on the obligation of a mortgage. Everyone should realize that, unless you are living with your parents rent free, you are paying a mortgage – either yours or your landlord’s.

    As an owner, your mortgage payment is a form of ‘forced savings’ that allows you to build equity in your home that you can tap into later in life. As a renter, you guarantee your landlord is the person with that equity.

    Are you ready to put your housing cost to work for you?

    Christina Boyle, Senior Vice President and Head of Single-Family Sales & Relationship Management at Freddie Mac, explains another benefit of securing a mortgage vs. paying rent:

    “With a 30-year fixed rate mortgage, you’ll have the certainty & stability of knowing what your mortgage payment will be for the next 30 years – unlike rents which will continue to rise over the next three decades.”

    Bottom Line

    This holiday season, why not give yourself the gift of homeownership? Lock in your housing costs for the next 30 years and guarantee you are the one building wealth.

  • 2018 Real Estate Predictions

    2018 Real Estate Predictions


    Each year I take time to review what has happened during the year and to look forward to predict what is in store for real estate.  Below are my predictions for the 2018 real estate market, based on data that was available at the time this was written:

    Interest Rates – With the Tax Reform Bill and new infrastructure, I expect interest rates to rise. A climb to 4.0%-4.5% is probable but it is possible that if the economy grows at a good clip next year, we could see rates as high as 5%. I believe the average for the year will be about 4.6%. Although this rise will cause some buyers to regroup, it will not be enough to make a strong market shift and cause buyers to leave the market in droves.


    Home Price Growth – With double digit percentage price increases in many markets across the country in 2017, I believe we will move back to price inclines below 10% in those busy markets. In fact, I foresee that the average for those areas that did see such strong increases in 2017 will scale back to about 4-7% gains in 2018. Nationally, I expect prices to increase about 3.2%. Although we still have significant challenges with our inventory, incomes cannot sustain the rapid price growth we have seen regionally over the last few years, and therefore, prices will not rise as quickly. 


    New Construction – There is still a severe shortage of new construction. Our country needs about 1.5 million new starts per year to maintain inventory, but since 2009, we have been short a cumulative almost 6 million units. This is one of the primary causes of our inventory shortage and what is driving prices up – demand outweighs supply. Local issues in many areas such as zoning and water rights are also capping new construction opportunity. In addition, the cost of building supplies is causing problems for our builders and I expect this problem to worsen in 2018. Since the market correction, we are still not back up to the 1.5 million starts needed (2016 projection is 1,173,800 units), so our new construction inventory crisis will continue until we can replace the six million units we are short AND get back on track to 1.5 million starts per year.  I don’t foresee us making gains in this category in 2018.

    Housing Inventory –  Although there are improvements in this category because we are adding some new housing units, it may take years or more for inventory levels to get back to a balanced level. Our inventory shortage was caused by a shortage of housing starts that began during the recession as outlined above. We will continue to see inventory challenges until new construction picks up even further. Additionally, I predict that more buyers will be entering the market for a home as our economy is strong with low unemployment, which I suspect will get even lower due to our economy. According to the Bureau of Labor Statistics, the national unemployment rate stands at 4.1% for November 2017, which is the lowest it has been since December of 2000. I predict unemployment to be in the high 3% range by the end of 2018. High demand and low amounts of new construction means a continued inventory crunch, although a rise in interest rates may relieve this demand a touch.

    Furthermore, I am often asked when the bubble will burst or we will see another crash. I do not foresee this in the upcoming year. Although we are seeing prices rise quickly, the conditions that our national market is facing now are not the same as what we saw just a decade ago. There isn’t the easy access to credit as was before the last crash when banks were more de-regulated. There aren’t enough new or resale home to satiate current demand, unlike the building boom of the mid-2000s. Buyers are not overleveraged and, in many cases, have to put more cash down to compete in multiple-offer situations allowing buyers to start in a higher equity position. Based on our history and the facts that are in front of us, I don’t believe another crash is likely at all.

    I am excited for what 2018 has in store! For additional information and predictions on our local market, please call or text: (253) 222-2626 or send an email to john@altitude-re.com.

  • Let’s Talk Housing Affordability

    shutterstock_68570026-copy

    Housing Affordability Index 

    The Housing Affordability Index (HAI) is a metric that the National Association of REALTORS® uses to measure the relationship between median sales prices, interest rates, and median incomes. The Index was formed to determine whether or not a typical family earnings are enough to qualify for a mortgage loan on a typical home. These values are then tabulated and result in a numeric value – the HAI. The National Association of REALTORS® indicates that if the HAI returns a value of 100, a family making the median income has exactly the right amount of income (with no other factors analyzed) to qualify for a mortgage on a median-priced home. If the index returns a value over 100, then a family earning a median income has more than enough to qualify for a median priced home at the current interest rate.

    Let’s compare October 2016’s numbers with October 2015’s:

    October 2015

    October 2016

    Change

    Median Sales Price*

    $220,600

    $233,700

    +5.9%

    Mortgage Rate**

    4.05%

    3.76%

    -7.2%

    Corresponding Monthly Payment***

    $848

    $867

    +2.2%

    Median Family Income****

    $68,956

    $70,810

    +2.7%

    Housing Affordability Index

    169.4

    170.2

    +4.7%


    Interestingly enough, although home prices have increased 5.9% over the last year, the drop in interest rates and the rise in incomes was enough to offset this, resulting in a higher Housing Affordability Index rate than October of 2015. As prices and interest rates in-particular rise over the next year, I expect the Housing Affordability Index will adjust downward unless median incomes can rise and keep pace.

    Looking at the different regions in our nation, the Midwest is most affordable with a median home price of $182,500, interest rates at 3.8%, and a median income of $70,796 (resulting in an HAI of 216.9) whereas the West is least affordable with a median home price of $348,800, interest rate of 3.72%, and a median income of $74,440 (resulting in an HAI of 120.4).

    The Housing Affordability Index annualized rate was at its lowest point back in 1989. At that point it was 106.4 and the interest rates topped 10%.

    Remember, when you buy a home with a fixed rate mortgage, the monthly payment (principal and interest) is a fixed amount. Salaries will increase in the coming years, but that principal and interest payment gets fixed in time.

    If you are thinking about buying or upgrading your home in the next year, housing affordability may be a top-of-mind topic for you. Questions? Give me a call or text: (253) 222-2626 or email John@altitude-re.com.

    *National Median Existing Home Resale Price as compiled by the National Association of REALTORS®

    ** Reported by the Federal Housing Finance Board and includes amortization of initial fees and charges

    ***Assumes a down payment of 20% of the home price

    ****As measured by The Census Bureau. Assumes the monthly principal and interest cannot exceed 25% of the median family monthly income.

    Source: https://www.nar.realtor/topics/housing-affordability-index/background