Category: Altitude Real Estate

  • Homeowner’s Net Worth Is Still Greater Than a Renter’s

    Homeowner’s Net Worth Is Still Greater Than a Renter’s

    Every three years, the Federal Reserve conducts their Survey of Consumer Financesin which they collect data across all economic and social groups. The latest survey, which includes data from 2010-2013, reports that a homeowner’s net worth is 36 times greater than that of a renter ($194,500 vs. $5,400). 

    The latest survey data, covering 2014-2016 will be released later this year. In the meantime, Lawrence Yun, the National Association of Realtors’ Chief Economistestimates that the gap has widened even further, to 45 times greater ($225,000 vs. $5,000)! 

    Put Your Housing Cost to Work for You

    As we’ve said before, simply put, homeownership is a form of ‘forced savings.’ Every time you pay your mortgage, you are contributing to your net worth. Every time you pay your rent, you are contributing to your landlord’s net worth.

    The latest National Housing Pulse Survey from NAR reveals that 84% of consumers believe that purchasing a home is a good financial decision. William E. Brown comments:

    “Despite the growing concern over affordable housing, this survey makes it clear that a strong majority still believe in homeownership and aspire to own a home of their own. Building equity, wanting a stable and safe environment, and having the freedom to choose their neighborhood remain the top reasons to own a home. 

    Bottom Line

    If you are interested in finding out if you could put your housing cost to work for you by purchasing a home, let’s get together and evaluate your ability to buy today!

  • Hey, Millennial Homeowners!! It May Be Time to Sell

    Hey, Millennial Homeowners!! It May Be Time to Sell

    Contrary to what many believe, Millennials are not the ‘renter’ generation. Millennials purchased a larger percentage (34%) of homes in the U.S. than any other age group in 2017 and the most recent Census Bureau report shows that the homeownership rate among Millennials is finally on the rise.

    Many Millennials took advantage of post housing crash prices and the First-Time Homebuyers’ Tax Credit and jumped into homeownership in 2010. If you are one of these buyers, now may be the time to sell for many reasons. Here are a few:

    1. Equity Build-Up

    Home prices have been on the rise since the beginning of 2012 and your house may have appreciated by more than you think. ATTOM Data Solutions, in their Q2 2017 U.S. Home Sales Report revealed that:

    “…homeowners who sold in the second quarter realized an average price gain of $51,000 since purchase — the highest average price gain for home sellers since Q2 2007, when it was $57,000.

    The average home seller price gain of $51,000 in Q2 2017 represented an average return of 26 percent on the previous purchase price of the home, the highest average home seller return since Q3 2007, when it was 27 percent.”

    2. Projected Home Price Increases

    If you just got married or just found out you are about to become a parent, you may have plans to move up a bigger home or perhaps move to a different area. Waiting to buy a more expensive home in this market probably doesn’t make sense. The experts contacted for the Home Price Expectation Survey are projecting home prices to increase by nearly 5% over the next year. Yes, your house’s price will increase but not as much as a home currently valued higher than yours.

    3. Projected Interest Rate Increases

    The Mortgage Bankers’ AssociationFreddie Mac, Fannie Mae and the National Association of Realtors are each projecting mortgage rates to increase over the next year.

    Higher PRICES + Higher INTEREST RATES = LARGER MORTGAGE PAYMENTS.

    Bottom Line

    If you are lucky enough to be one of those Millennials who purchased a house in 2010 (or even later), now might be the perfect time to move up to the home of your dreams!

  • What State Gives You the Most ‘Bang for Your Buck’?


    Some Highlights:

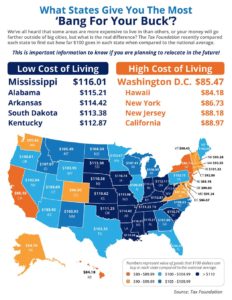
    • Thinking of moving across the country? How far will your money take you?
    • The majority of states in the Midwest and South offer a lower cost of living compared to Northeast and Western states.
    • The ‘Biggest Bang for your Buck’ comes in Mississippi where, compared to the national average, you can actually purchase $116.01 worth of goods for $100.
    • For more information regarding the methodology used to create the map, visit the Tax Foundation.
  • Housing Inventory Hits 30-Year Low

    Housing Inventory Hits 30-Year Low

    Spring is traditionally the busiest season for real estate. Buyers, experiencing cabin fever all winter, emerge like flowers through the snow in search of their dream home. Homeowners, in preparation for the increased demand, are enticed to list their house for sale and move on to the home that will better fit their needs.

    New data from CoreLogic shows that even though buyers came out in force, as predicted, homeowners did not make the jump to list their home in the second quarter of this year. Frank Nothaft, Chief Economist for CoreLogic had this to say,

    “The growth in sales is slowing down, and this is not due to lack of affordability, but rather a lack of inventory. As of Q2 2017, the unsold inventory as a share of all households is 1.9 percent, which is the lowest Q2 reading in over 30 years.”

    CoreLogic’s President & CEO, Frank Martell added,

    “Home prices are marching ever higher, up almost 50 percent since the trough in March 2011.

    While low mortgage rates are keeping the market affordable from a monthly payment perspective, affordability will likely become a much bigger challenge in the years ahead until the industry resolves the housing supply challenge.”

    Overall inventory across the United States is down for the 25th consecutive month according to the latest report from the National Association of Realtorsand now stands at a 4.3-month supply.

    Real estate is local.

    Market conditions in the starter and trade-up home markets are in line with the median US figures, but conditions in the luxury and premium markets are following an opposite path. Premium homes are staying on the market longer with ample inventory to suggest a buyer’s market.

    Bottom Line

    Buyers are out in force, and there has never been a better time to move-up to a premium or luxury home. If you are considering selling your starter or trade-up home and moving up this year, let’s get together to discuss the exact conditions in our area.

  • 93.9% Of Homes in The US Have Positive Equity

    93.9% Of Homes in The US Have Positive Equity | MyKCM

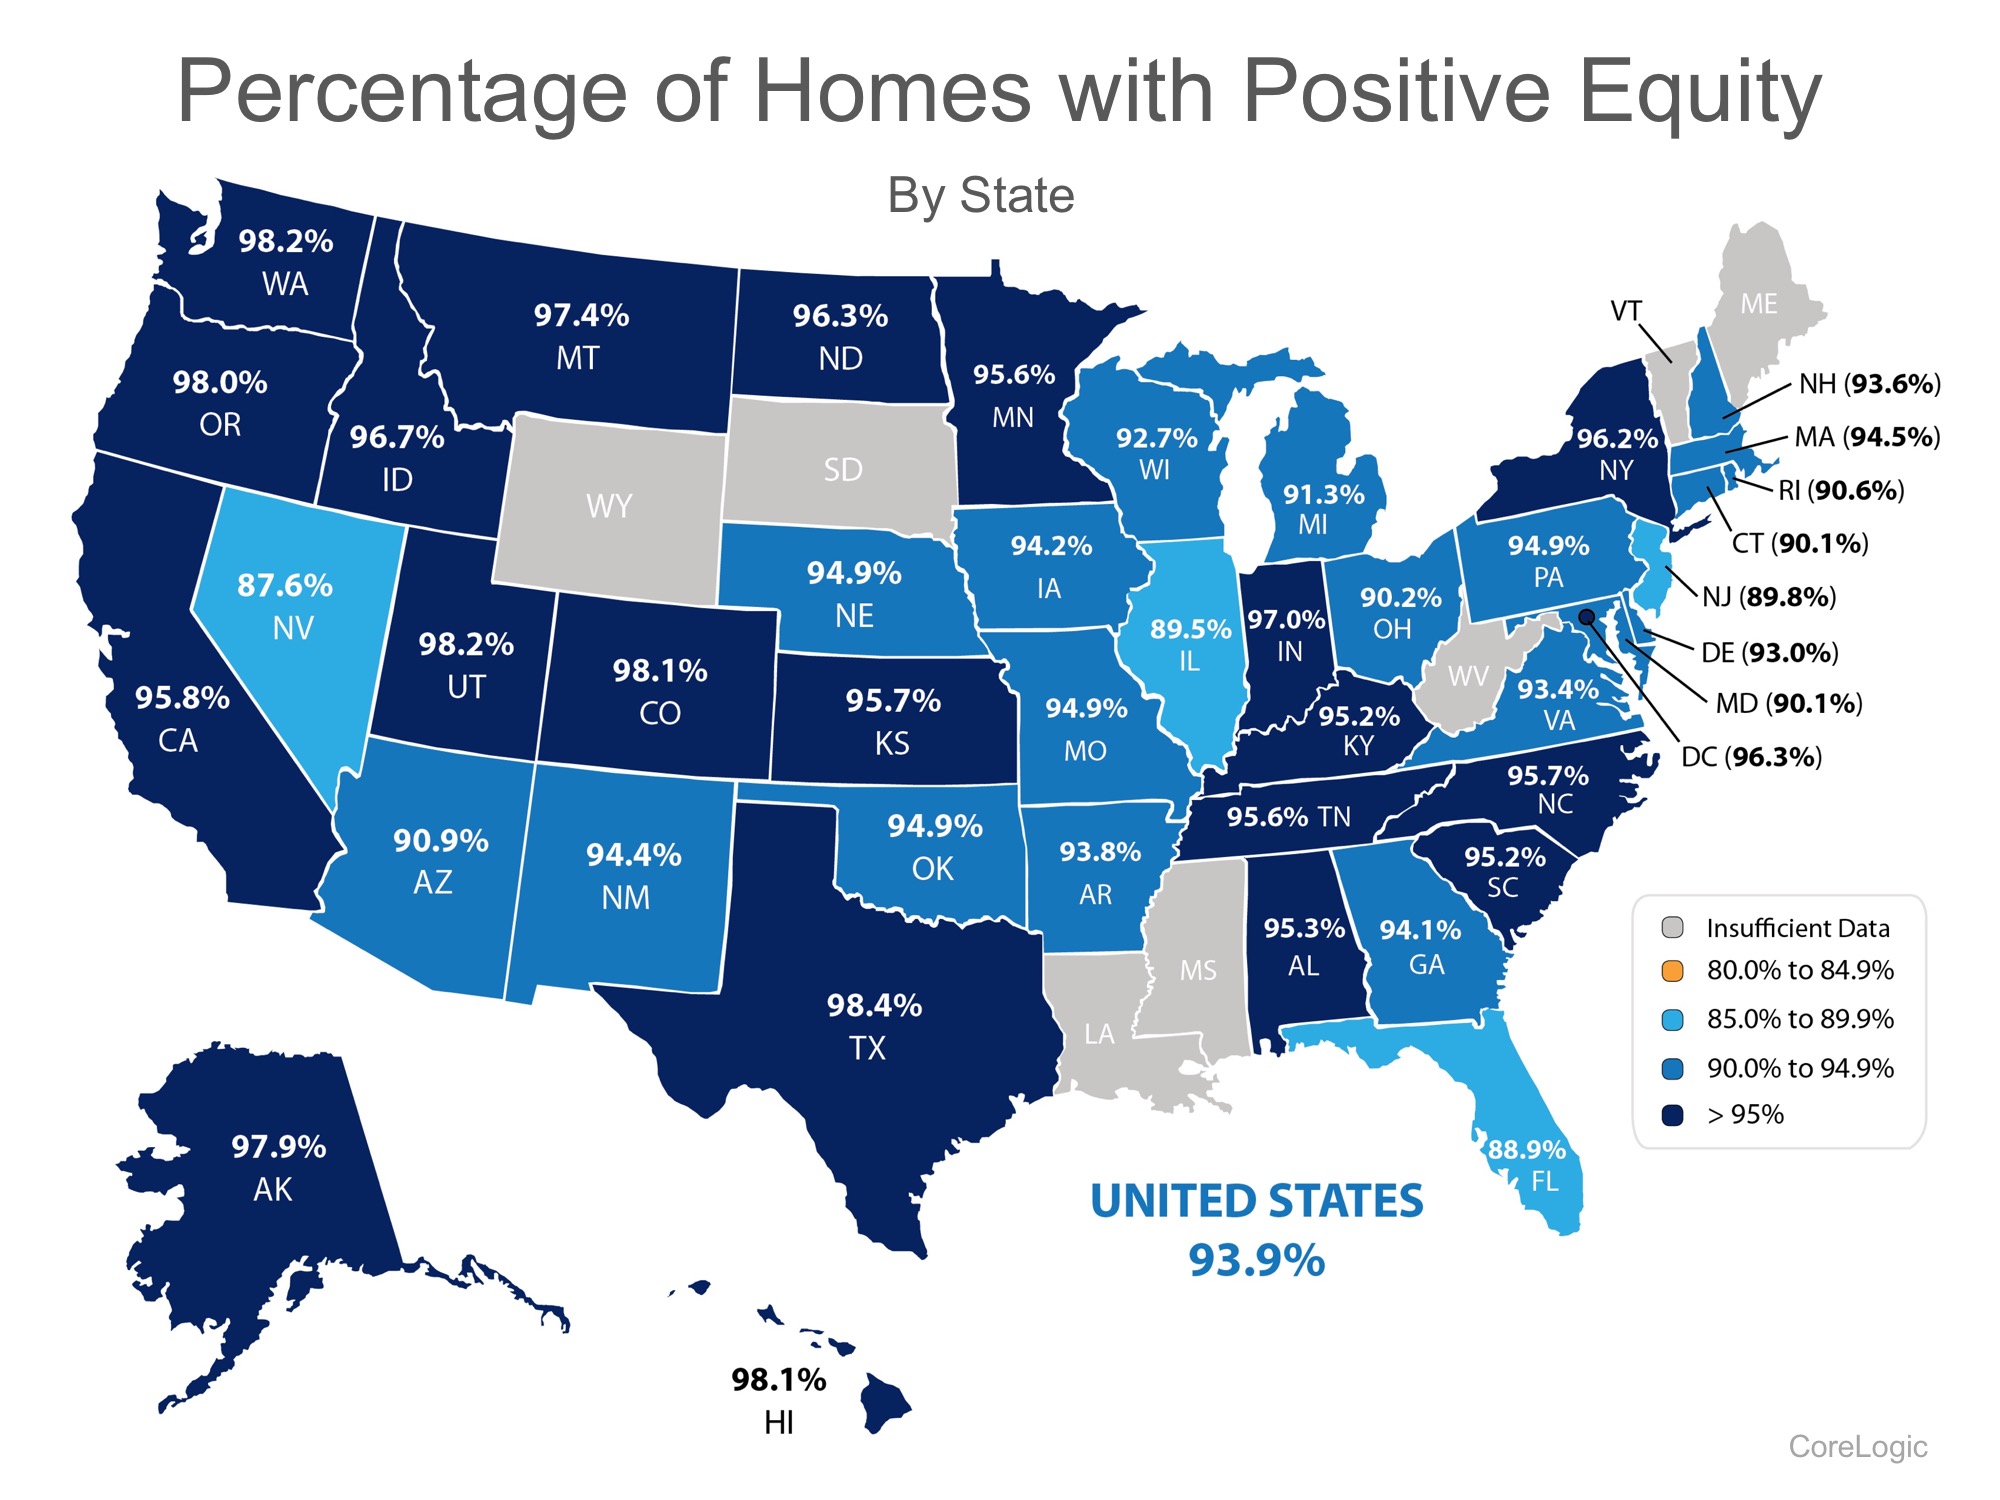
    CoreLogic’s latest Equity Report revealed that ninety-one thousand residential properties regained equity in Q1 2017. The outlook for 2017 remains positive as well, as an additional 600 thousand properties will regain equity if home prices rise another 5% this year.

    The study also revealed that:

    • Roughly 63% of all homeowners have seen their equity increase since Q1 2016
    • The average homeowner gained about $14,000 in equity between Q1 2016 and Q1 2017
    • Only 1.6% of residential properties are near-negative equity

    Below is a map showing the percentage of homes with a mortgage, in each state, that have positive equity. (The states in gray have insufficient data to report.)

    93.9% Of Homes in The US Have Positive Equity | MyKCM

    Significant Equity Is On The Rise

    Frank Martell, President & CEO of CoreLogic, believes this is great news for the “long-term health of the U.S. economy.” He went on to say:

    “Homeowner equity increased by $766 billion over the last year, the largest increase since Q2 2014. The rising cushion of home equity is one of the main drivers of improved mortgage performance. Since home equity is the largest source of homeowner wealth, the increase in home equity also supports consumer balance sheets, spending and the broader economy.”

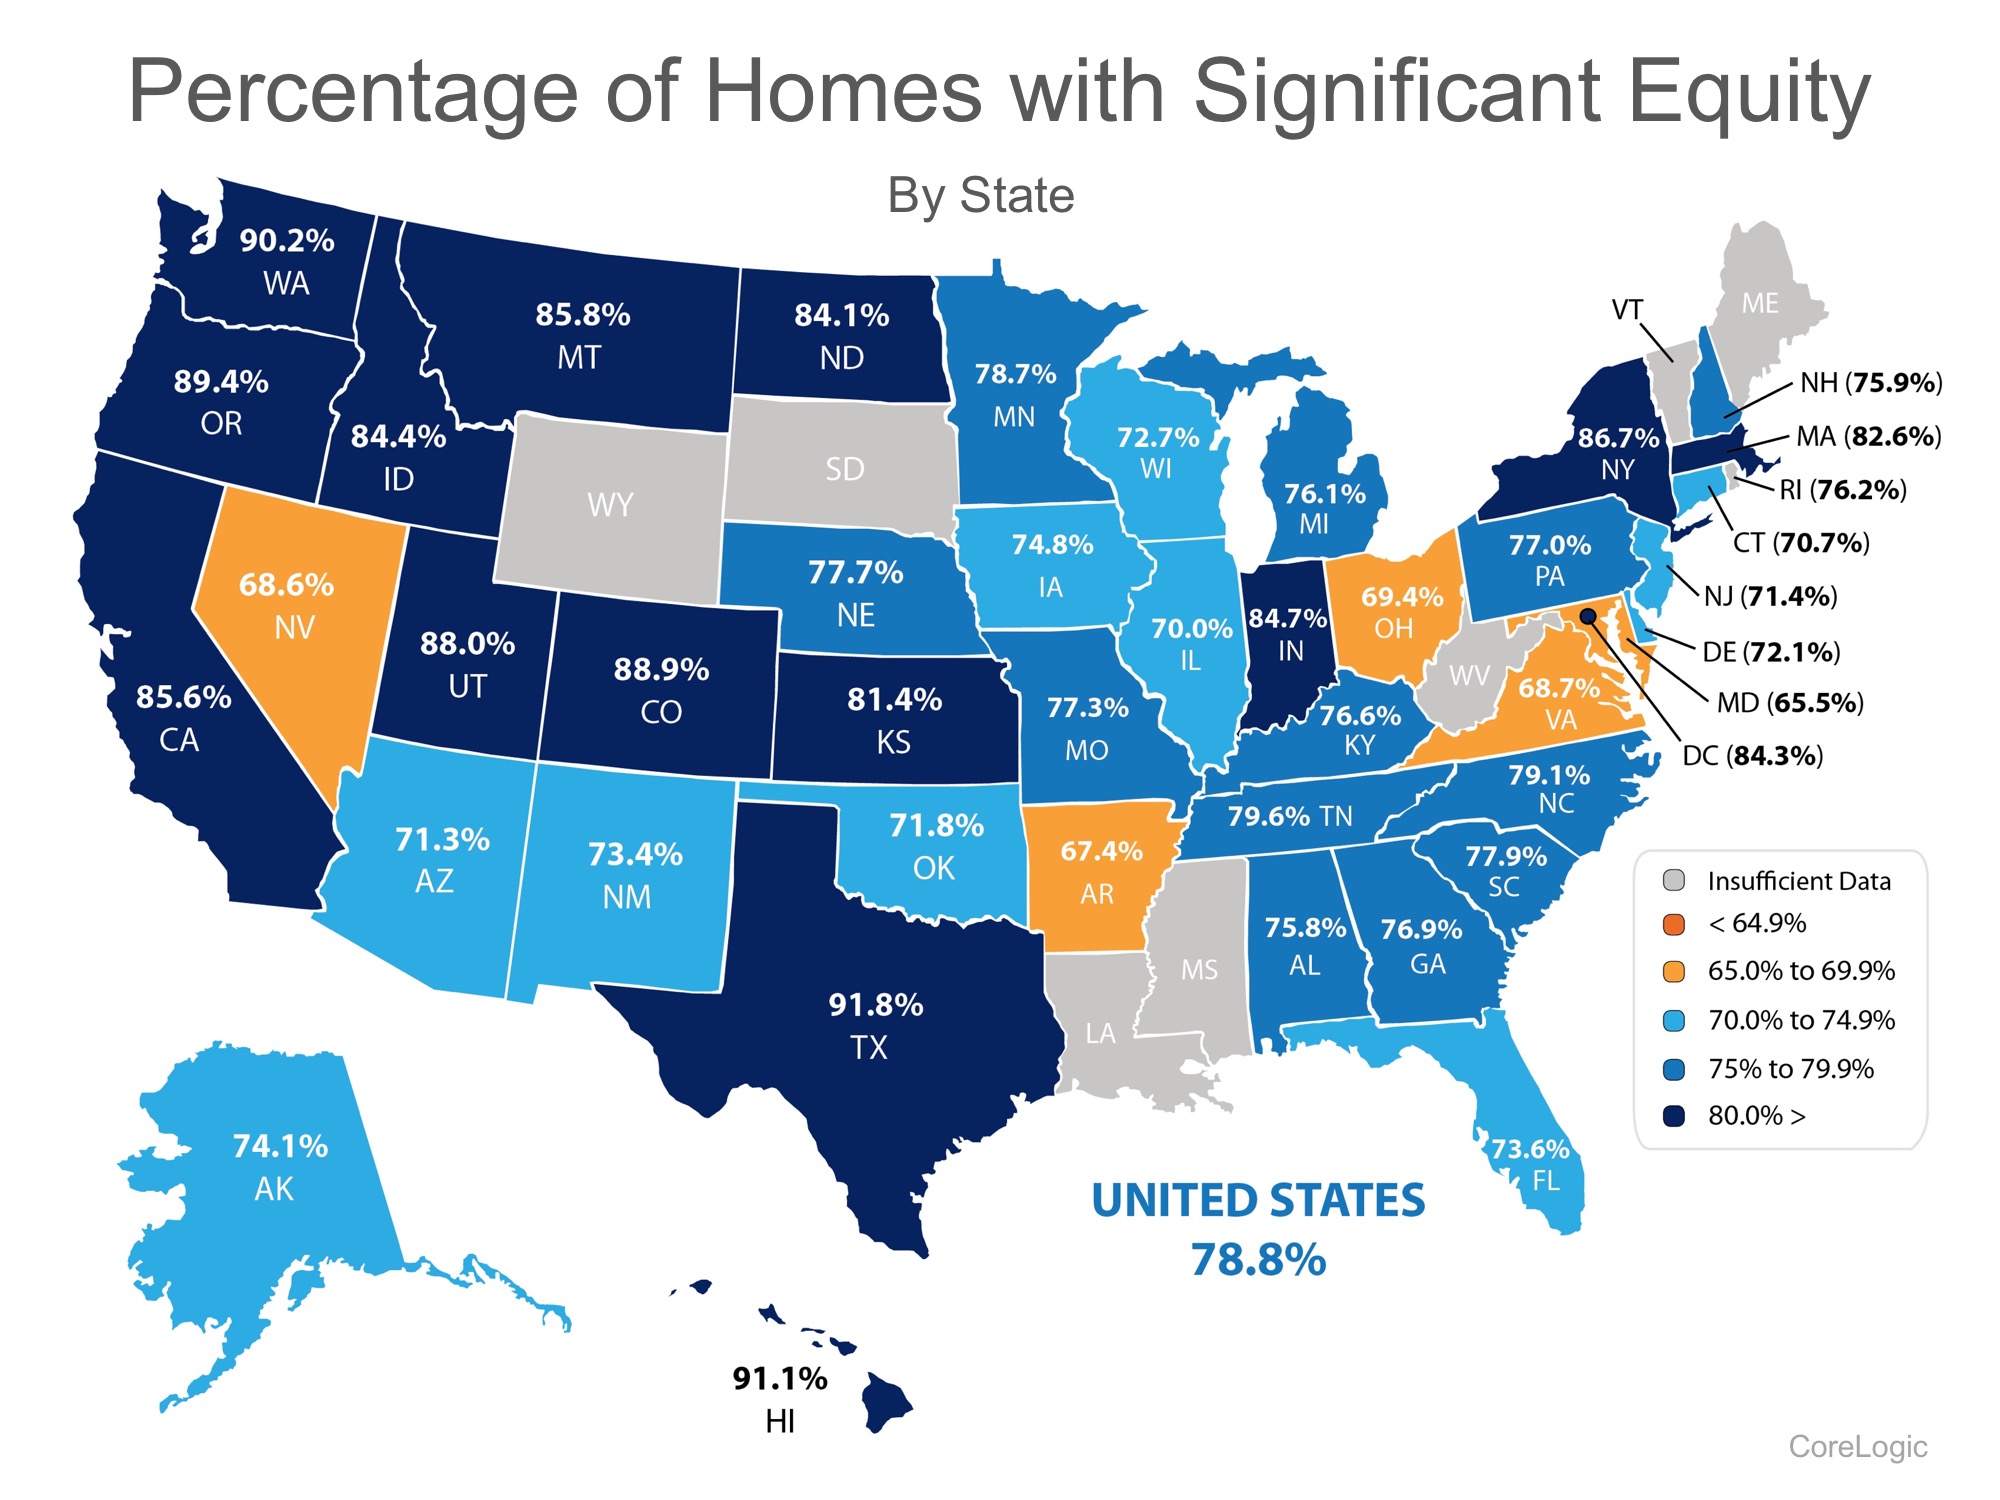
    Of the 93.9% of homeowners with positive equity in the US, 78.8% have significant equity (defined as more than 20%). This means that nearly three out of four homeowners with a mortgage could use the equity in their current home to purchase a new home, now.

    The map below shows the percentage of homes with a mortgage, in each state, that have significant equity. (The states in gray have insufficient data to report.)

    93.9% Of Homes in The US Have Positive Equity | MyKCM

    Bottom Line 

    If you are one of the many homeowners who are unsure of how much equity they have in their homes and are curious about their ability to move, let’s meet up to evaluate your situation.

  • How Long Do Most Families Stay in Their Home?

    How Long Do Most Families Stay in Their Home? | MyKCM

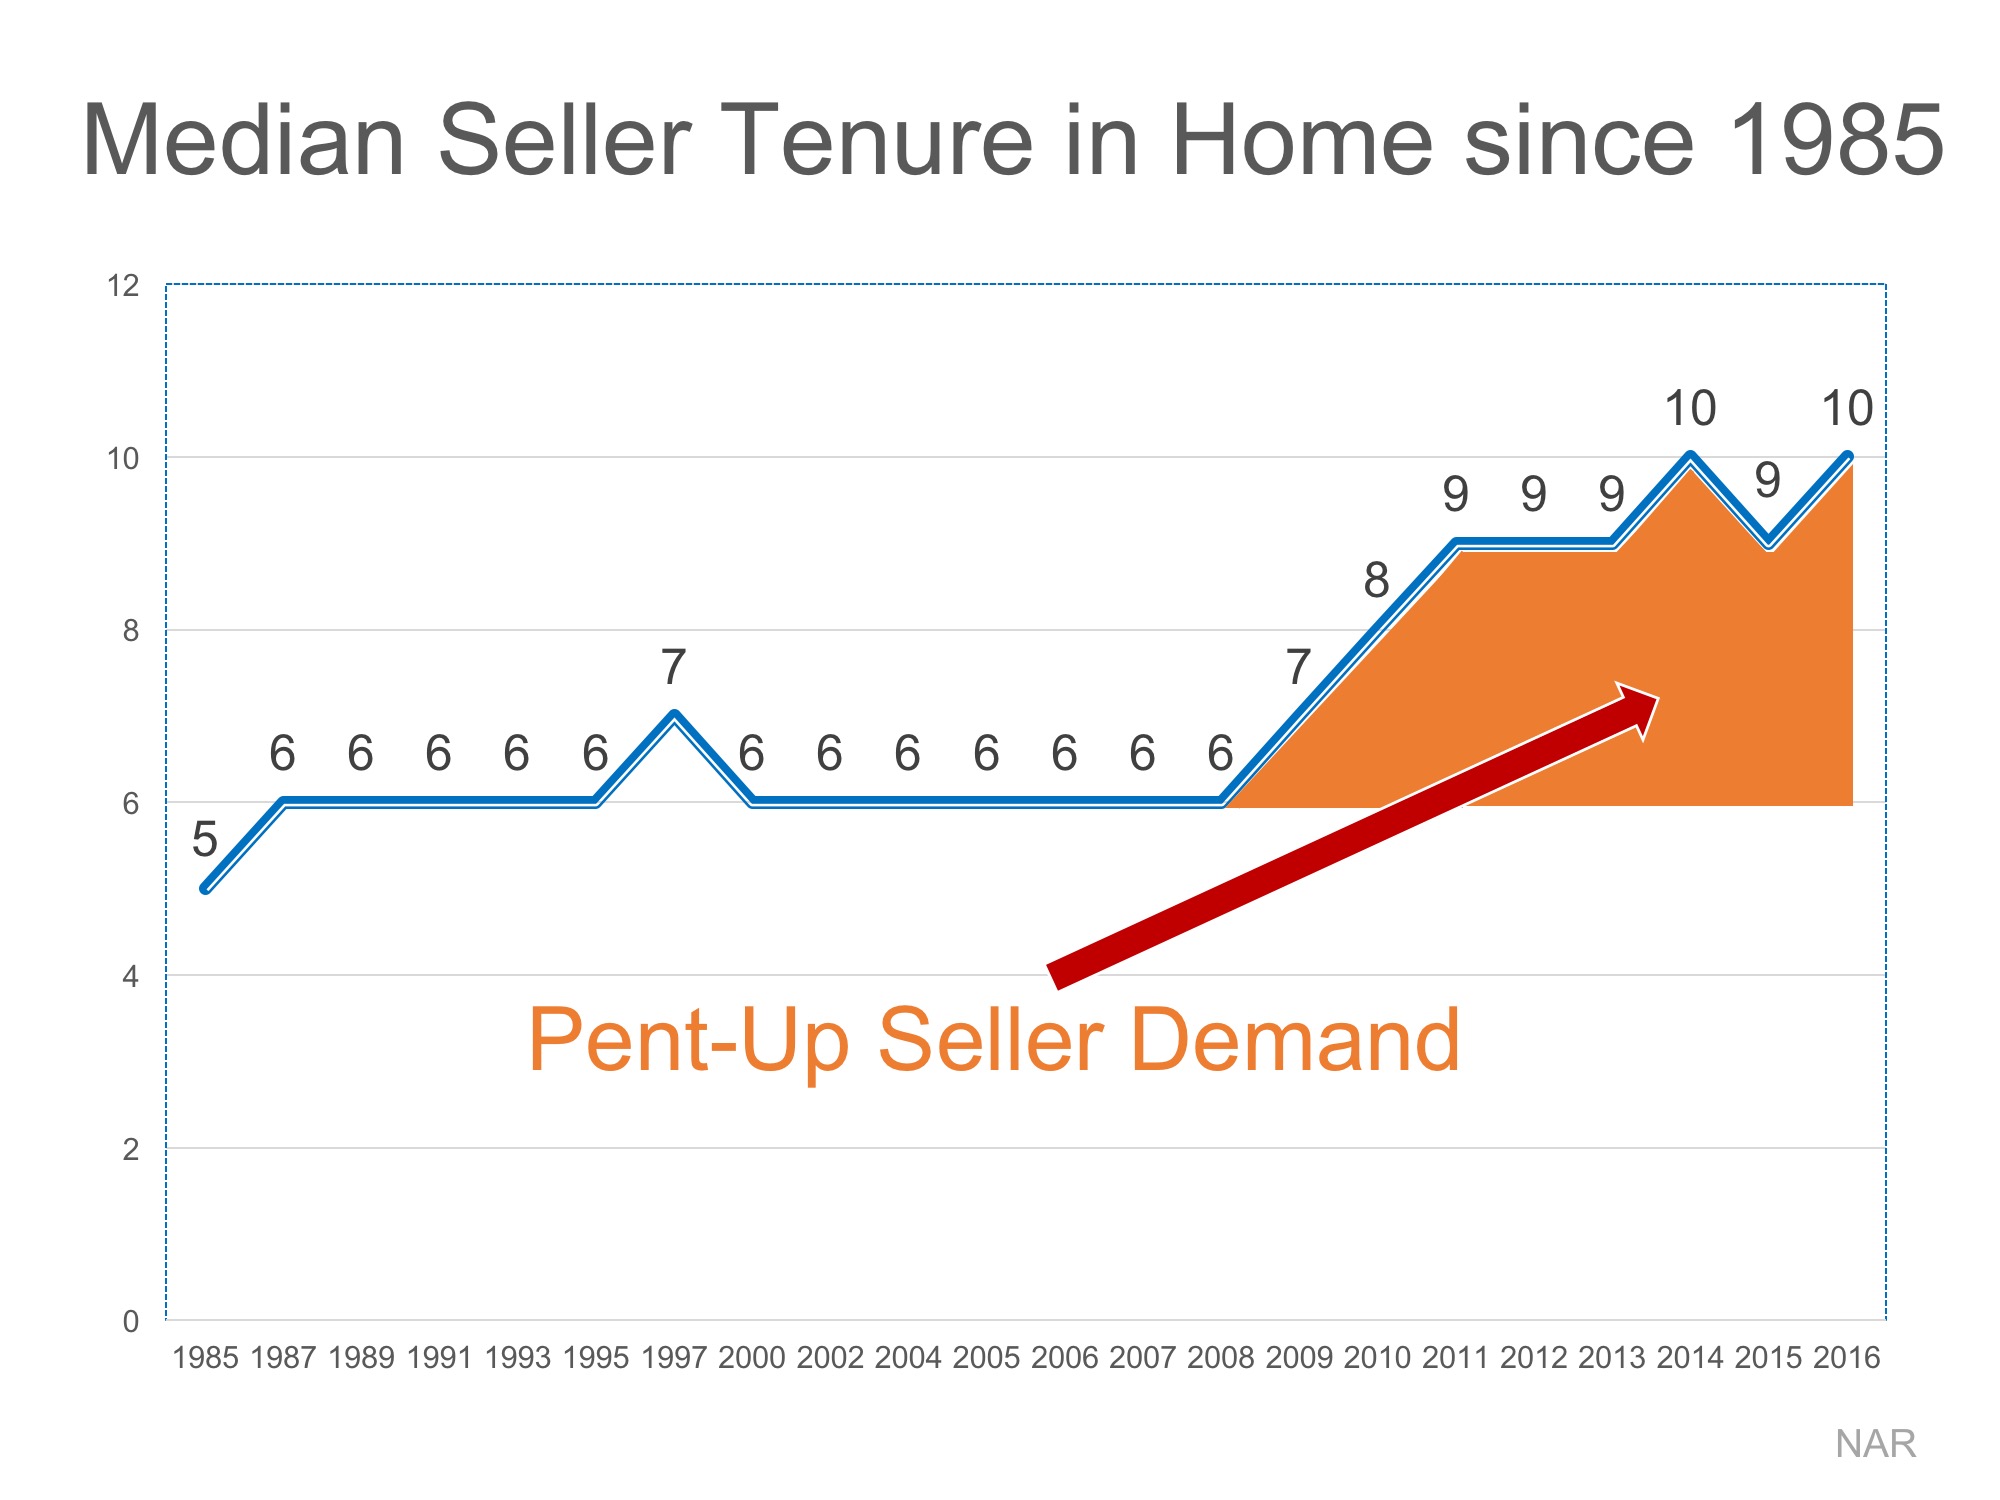
    The National Association of Realtors (NAR) keeps historical data on many aspects of homeownership. One of the data points that has changed dramatically is the median tenure of a family in a home, meaning how long a family stays in a home prior to moving. As the graph below shows, for over twenty years (1985-2008), the median tenure averaged exactly six years. However, since 2008, that average is almost nine years – an increase of almost 50%.

    How Long Do Most Families Stay in Their Home? | MyKCM

    Why the dramatic increase?

    The reasons for this change are plentiful!

    The fall in home prices during the housing crisis left many homeowners in a negative equity situation (where their home was worth less than the mortgage on the property). Also, the uncertainty of the economy made some homeowners much more fiscally conservative about making a move.

    With home prices rising dramatically over the last several years, 93.9% of homes with a mortgage are now in a positive equity situation with 78.8% of them having at least 20% equity, according to CoreLogic.

    With the economy coming back and wages starting to increase, many homeowners are in a much better financial situation than they were just a few short years ago.

    One other reason for the increase was brought to light by NAR in their 2017 Home Buyer and Seller Generational Trends Report. According to the report,

    Sellers 36 years and younger stayed in their home for six years…”

    These homeowners who are either looking for more space to accommodate their growing families or for better school districts are more likely to move more often (compared to 10 years for typical sellers in 2016). The homeownership rate among young families, however, has still not caught up to previous generations, resulting in the jump we have seen in median tenure!

    What does this mean for housing?

    Many believe that a large portion of homeowners are not in a house that is best for their current family circumstance; They could be baby boomers living in an empty, four-bedroom colonial, or a millennial couple living in a one-bedroom condo planning to start a family.

    These homeowners are ready to make a move, and since a lack of housing inventory is still a major challenge in the current housing market, this could be great news.

  • Millennial Homeownership Rate Increases

    Millennial Homeownership Rate Increases

    Recent headlines exclaimed the homeownership rate, as reported by the Census Bureau, rose again in the second quarter of 2017. What didn’t get much attention in the reports is that the homeownership rate for American households under the age of 35 increased a full percentage point from last quarter’s 34.3% to 35.3%. Millennials proved to have the highest increase of any age group.

    This came as a surprise to some considering Millennials have come to be known as the “renter” generation. However, a new study by First American6 Trends Poised to Reshape Homeownership Demandrevealed reasons why homeownership numbers will continue to increase for Millennials.

    Millennials are the most educated generation in the U.S.

    Why does that matter? First American explains:

    “Our model shows that, all other factors being equal, the likelihood of homeownership increases by 3 percent for those that earn a bachelor’s degree over those with a high school degree. The likelihood of homeownership jumps another 3 percent for those that earn a graduate degree.”

    The more educated, the better the likelihood for homeownership. And, as we mentioned: Millennials are the most educated generation in the U.S.

    Homes & marriage go together

    Marriage is a key determinate in homeownership. According to an analysis by First American, the homeownership rate is 30% higher among married couples compared to non-married households.

    Millennials have put off marriage in the pursuit of higher education. As this group ages, more and more will marry and purchase a home.

    Parents buy houses

    According to the study:

    “The homeownership rate is 1.7% higher for households with one or two children compared to households with no children, and it is 5.4 percent higher for households with three or more children.”

    The report goes on to say that as Millennials grow older there may be an increase in not just marriage but also in married couples with children. That will probably also create a “corresponding” increase in homeownership demand.

    Wages and the economy

    The study goes on to explain that recent gains in income growth and a strengthening economy will also help all generations (including Millennials) be more willing and able to purchase a new home.

    Bottom Line

    We guess the time has come to announce – Here come the Millennials!!

  • Do Your Future Plans Include a Move? What’s Stopping You from Listing Now?

    Do Your Future Plans Include a Move? What’s Stopping You from Listing Now?

    Are you an empty-nester? Do you want to retire where you are, or does a vacation destination sound more your style? Are you close to retirement and not ready to move yet, but living in a home that is too big in size and maintenance needs?

    How can you line up your current needs with your goals and dreams for the future? The answer for many might be the equity you have in your house.

    According to the latest Equity Report from CoreLogic, the average homeowner in the United States gained $14,000 in equity over the course of the last year. On the West Coast, homeowners gained twice that amount, with homeowners in Washington gaining an average of $38,000!

    Do you know how much your home has appreciated over the last year?

    Many homeowners would be able to easily sell their current house and use the profits from that sale to purchase a condo nearby in order to continue working while eliminating some of the daily maintenance of owning a house (ex. lawn care, snow removal).

    With the additional cash gained from the sale of the home, you could put down a sizeable down payment on a vacation/retirement home in the location that you would like to eventually retire to. While you will not yet be able to live there full-time, you can rent out your property during peak vacation times and pay off your mortgage faster.

    Purchasing your retirement home now will allow you to take full advantage of today’s seller’s market, allow you to cash in on the equity you have already built, and take comfort in knowing that a plan is in place for a smooth transition into retirement.

    Bottom Line

    There are many reasons to relocate in retirement, including a change in climate, proximity to family & grandchildren, and so much more. What are the reasons you want to move? Are the reasons to stay more important? Let’s get together to discuss your current equity situation and the options available for you, today!

  • Be Careful Not to Get Caught in The Rental Trap!

    Be Careful Not to Get Caught in The Rental Trap!

    There are many benefits to homeownership. One of the top benefits is being able to protect yourself from rising rents by locking in your housing cost for the life of your mortgage.

    Don’t Become Trapped 

    A recent article by ConsumerAffairs addressed the continuous rise in rents, stating:

    “The cost of putting a roof over your head continues to go up. Not only are home prices still rising, but the cost of rent rose 0.5% in June.”

    Additionally, in the Joint Center for Housing Studies at Harvard University’s 2017 State of the Nation’s Housing Report, it was revealed that,

    “Despite a slight improvement from 2014, fully one-third of US households paid more than 30 percent of their incomes for housing in 2015. Renters continue to be more likely to face cost burdens…the number of cost-burdened renters (21 million) considerably outstrips the number of cost-burdened owners (18 million) even though nearly two-thirds of US households own their homes.”

    These households struggle to save for a rainy day and pay other bills, including groceries and healthcare.

    It’s Cheaper to Buy Than Rent 

    As we have previously mentioned, the results of the latest Rent vs. Buy Report from Trulia shows that homeownership remains cheaper than renting with a traditional 30-year fixed rate mortgage in the 100 largest metro areas in the United States.

    The updated numbers show that the range is an average of 3.5% less expensive in San Jose (CA), all the way up to 50.1% less expensive in Baton Rouge (LA), and 33.1% nationwide!

    Know Your Options

    Perhaps you have already saved enough to buy your first home. A nationwide survey of about 24,000 renters found that 80% of millennial renters plan to eventually buy a house, but 72% cite affordability as their primary obstacle. Aside from affordability, one in three millennial renters have concerns about their credit scores, and another 53% said that a down payment is an obstacle.

    Many first-time homebuyers who believe that they need a large down payment may be holding themselves back from their dream homes. As we have reported before, in many areas of the country, a first-time home buyer can save for a 3% down payment in less than two years. You may have already saved enough!

    Bottom Line

    Don’t get caught in the trap that so many renters are currently in. If you are ready and willing to buy a home, find out if you are able. Let’s get together to determine if you can qualify for a mortgage now!

  • Painting 101


    Painting 101

    Painting is one of the least expensive ways you can make a home feel refreshed and provide a stellar first impression. If painting is on your “to-do” list, whether it is to get a home ready for the market or just to spruce up a room or two, there are some things you should consider:

    1. Color – If you are going to be moving in the near future, consider colors that are will appeal to the widest pool of buyers – usually neutrals. Note, neutral doesn’t necessarily mean boring and doesn’t necessarily mean you have to stick to white, beige, or the newest option, greige. However, choosing a color that buyers feel they can live with for a year or two will pull potential buyers in so they can see the structure of the rooms and layout themselves and not be jarred by the palette. A little color can be used, but the key is to keep the intensity of the colors down.
    2. Tape, tape, tape! – Sometimes it seems that at least half the time it takes to paint is taken up by taping off all the surfaces you don’t want painted. This step is critical and can save you hours of detailed clean-up down the road. Also, finding the right tape for the job and making sure it adheres properly to the surface is essential.
    3. Dropcloth – Even the best painters use a dropcloth, especially if they are using a roller. Small droplets of paint can fly off when rolling and can hit the floor or your furniture. The mess may need an easy wipe-up with wood floors or vinyl, but carpet and furniture is a different issue.
    4. The Right Tools – Once you have your area taped off and your dropcloth down, make sure you have the right tools in the room with you. You should avoid having to step away from the project to find something or even worse, have to make a run to the store. Do you have the right brushes, rollers, paint tray, something to hold a small amount of paint if you are up on a ladder or stepstool, wet paper towels if you need a quick wipe up?
    5. Sheen matters – Eggshell, satin, gloss, semi-gloss…it can all be very confusing. Sheen basically refers to the amount of light the finish will reflect once it is dried. Flat paint (which is a term most brands use) is usually the least reflective and high gloss is usually the most Paints with a higher sheen are usually more durable and can be wiped down. However, instead of choosing a paint sheen based on future wall maintenance needs, take a look at the wall first. Is the drywall riddled with pockmarks and texture inconsistencies? Drip marks from past paint jobs? In that case, consider choosing something with less sheen – even flat. The greater the reflection the more visible the defects. Furthermore, many higher-end paints are easier to clean, even with a flat finish.

    One of the best things about paint is if you don’t love it, it isn’t difficult to make a change. If you are selling, don’t underestimate the power of paint! Paint well and enjoy the results! I would be happy to discuss your paint options with you. Please call or text: 253-222-2626 or email john@altitude-re.com.